

According to the May Short-Term Energy Outlook (STEO), expectations are for a continuous rise in the U.S. benchmark Henry Hub natural gas spot price in 2023. Over the course of week ending June 23rd, the Henry Hub spot price experienced a significant increase, surging by 47 cents from $2.23 per million British thermal units (MMBtu) on Wednesday to reach $2.70/MMBtu by the end of the week on Friday. This rise in the spot price indicates a notable change in the market dynamics and suggests an increased demand or reduced supply of natural gas at the Henry Hub. In terms of NYMEX contracts, the July 2023 contract concluded with a closing price of $2.603/MMBtu. Although the increase was marginal, with just a 1-cent rise from the previous Wednesday, it still reflects some stability in the near-term market expectations for natural gas prices. On the other hand, the August 2023 NYMEX contract experienced a slight decline, dropping by 1 cent to settle at $2.668/MMBtu. This decrease indicates a potential shift in market sentiment or factors influencing the pricing of natural gas for the month of August. Looking ahead, the 12-month strip, which represents the average price of futures contracts spanning from August 2023 through July 2024, witnessed a decline of 5 cents. It closed at $3.185/MMBtu, suggesting a slight decrease in the market’s long-term outlook for natural gas prices during this period.
During the report week from Wednesday, June 21 to Wednesday, June 28, natural gas spot prices at major hubs exhibited an overall increase. The largest price hike of $4.43/MMBtu occurred at the Algonquin Citygate, which serves consumers in the Boston area. This rise can be attributed to ongoing maintenance on the Algonquin Gas Transmission system, leading to reduced gas flows into New England.
In the Northeast, several major hubs experienced price increases, ranging from 17 cents to 32 cents. The Tennessee Zone 4 Marcellus spot price remained unchanged. On the West Coast, prices rose across the board, with a significant increase of 96 cents at PG&E Citygate in Northern California and a smaller increase of 3 cents at SoCal Citygate in Southern California. The Sumas pricing point in the Pacific Northwest witnessed a price rise of 59 cents. Capacity constraints on the Westcoast Energy pipeline system contributed to higher prices in this region. In Texas, prices also went up, with a 26-cent increase at the Houston Ship Channel and a 31-cent increase at the Waha Hub in West Texas. The hotter temperatures in Texas led to higher air conditioning demand and increased electricity generation. Renewable sources, particularly wind generation, played a significant role in meeting the heightened electricity load, with wind power accounting for 25% of ERCOT’s electric power generation on Tuesday. Overall, the report highlights widespread price increases at major natural gas hubs, driven by factors such as maintenance work, capacity limitations, weather conditions, and increased power generation needs.
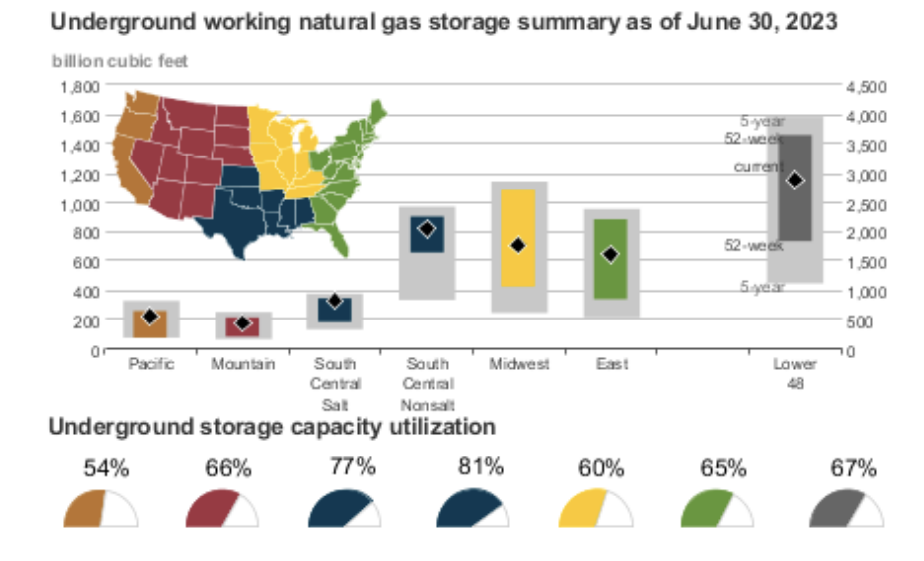
For the week ending June 23, natural gas injections into storage totaled 76 Bcf, slightly below the average of 80 Bcf observed in previous years. Current working stocks stand at 2,805 Bcf, representing a surplus of 358 Bcf (15%) compared to the five-year average and an increase of 566 Bcf (25%) compared to the previous year. The average injection rate during the refill season is running 7% higher than the five-year average. Based on historical rates, it is projected that total inventory will reach 3,953 Bcf by October 31, exceeding the five-year average by 358 Bcf.
In contrast, recent data shows a 2.4% increase in total natural gas consumption in the U.S., reaching 69.8 Bcf/d. Power generation consumption specifically saw a significant increase of 4.1% compared to the previous week. Consumption in the industrial sector remained stable, while the residential and commercial sectors experienced a modest uptick. These figures reflect a growing demand for power generation and a moderate increase in residential and commercial consumption, shaping the evolving landscape of natural gas usage.
In terms of exports, natural gas deliveries to Mexico experienced a slight decline of 1.6% (0.1 Bcf/d). However, there was positive growth in natural gas deliveries to U.S. LNG export facilities (LNG pipeline receipts), which averaged 11.5 Bcf/d. This represents a 0.6 Bcf/d increase compared to the previous week. These findings indicate a dynamic landscape in the natural gas sector, with increased consumption for power generation and a rise in residential and commercial sector usage. Although exports to Mexico declined slightly, deliveries to LNG export facilities displayed positive momentum. Such trends further highlight the ongoing importance and demand for natural gas across various sectors of the U.S. economy.
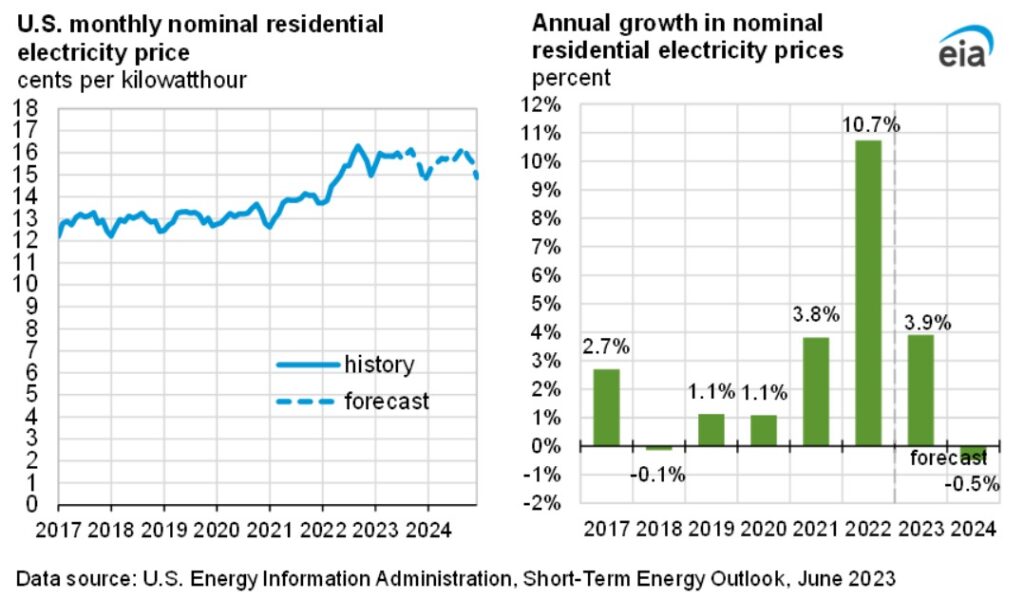
As summer arrives, electricity consumption becomes closely tied to weather conditions. With a large majority of U.S. households utilizing air conditioning, residential electricity usage reaches its peak during the summer months of June, July, and August. The southern states along the Gulf Coast, experiencing hot and humid climates, typically exhibit the highest electricity consumption per household. In contrast, regions with milder weather such as the Pacific Coast and New England consume less electricity during the summer due to less frequent air conditioning usage. Weather remains a significant factor of uncertainty in electricity bill forecasts, as hotter temperatures than anticipated can lead to increased costs, particularly in the southern states. Overall, this year’s projections indicate similar electricity usage to the previous summer, with some variations in specific regions. There will be an increase in electricity generation from solar, wind, and nuclear sources due to the addition of new generating capacity. Over the past 12 months leading up to May 2023, the U.S. electric power sector has added approximately 14 gigawatts of solar capacity and around 8 gigawatts of wind capacity.
Solar energy has been the primary contributor to new generating capacity in the United States this year, and this additional capacity contributes to our forecast of a 24% growth in U.S. solar generation compared to summer 2022. While wind capacity continues to expand, the rate of new additions has slightly slowed down. However, we still expect a 7% increase in wind generation during summer 2023 compared to summer 2022. Additionally, the Vogtle nuclear plant in Georgia will begin commercial operation this month, leading to a 2% growth in U.S. nuclear generation this summer. As a result of these developments, the forecast predicts a decrease of 15% in coal-fired generation. Despite natural gas remaining the largest source of electricity generation, there is a forecasted 3% increase in generation from natural gas-fired power plants due to additional capacity and favorable fuel costs.
The forward power prices in the Mid-Atlantic Region have risen for the second consecutive week as a result of recent increases in natural gas prices, primarily caused by scorching temperatures in Texas and a decrease in gas rig counts. Although prices had been declining due to a slow start in summer peak demand, there appears to be a shift as we enter July. On average, power forward prices for the 2024-2028 terms have experienced a 1% increase this week. However, when examined on a monthly basis, these terms have declined by 7% and currently stand at 19% below the highest point reached in the past year.
Index power prices, influenced by spot gas prices, have remained relatively low, but there is a potential for change in the upcoming month. In the West Hub, the average monthly settlement price for the current month is $26.90/MWh, reflecting an 11% decrease compared to May’s average and a significant 72% decrease compared to June 2022. Meanwhile, the average settlement price in the Eastern Hub thus far is $18.29/MWh, showing a month-on-month increase of 3% and a substantial 70% decrease compared to June 2022.
In terms of natural gas production, the forecast indicates an average of nearly 103 billion cubic feet per day (Bcf/d) in the second half of 2023, slightly lower than the estimated average of about 104 Bcf/d during April and May. This decline in production is a result of reduced natural gas-directed drilling, attributed to the significant decrease of over 75% in the Henry Hub natural gas spot price since its peak in August 2022. However, the decline in dry gas output is expected to be mostly offset by the growth in associated natural gas production in the Permian Basin. As for natural gas prices, an increase is anticipated throughout the summer due to a slight decline in production and higher demand for air conditioning, leading to increased natural gas usage in the electric power sector. The forecast projects the Henry Hub spot price to average around $2.90 per million British thermal units (MMBtu) in the second half of 2023, compared to the realized May average of $2.15/MMBtu. Furthermore, the forecast predicts a nearly 30% rise in the natural gas price at the Henry Hub in 2024 compared to 2023, with an average of approximately $3.40/MMBtu.
In the realm of electricity generation, solar energy has emerged as the primary source of new generating capacity in the United States this year. This additional capacity contributes to the forecast, which suggests that U.S. solar generation during the summer months of June, July, and August will be 24% higher than in summer 2022. The rise in solar capacity, combined with the decline in natural gas prices, leads to a projected decrease in coal-fired electricity generation this year. As a result, wholesale electricity prices in the eastern half of the country are expected to average approximately 50% lower in 2023 due to the impact of reduced natural gas prices. However, it is worth noting that temporary spikes in wholesale power prices may occur in the Northwest, Southwest, and California regions during the summer due to limited power supply during peak demand hours. Consequently, average monthly prices could surpass $100 per megawatthour in July and August.
F&D Partners was very successful in navigating one of the most volatile years in the energy markets by helping our clients save tremendously.
Contact us today for the newest strategies in the energy markets for 2023, 2024 and 2025.