

n the recent energy market trends, the Henry Hub spot price experienced a slight decline, dropping by 10 cents from $2.59 per million British thermal units (MMBtu) August 23rd to $2.49/MMBtu on August 30th. Meanwhile, the September 2023 NYMEX contract expired at $2.556/MMBtu August 29th, reflecting a modest increase of 6 cents compared to the previous week. Additionally, the October 2023 NYMEX contract price rose by 20 cents from prior week to the last week of August, reaching $2.796/MMBtu. The 12-month strip, encompassing October 2023 through September 2024 futures contracts, saw a 5-cent increase, resulting in a price of $3.345/MMBtu.
Generally. most areas observed an uptick in natural gas spot prices during the last week of August. West Coast markets experienced notable price increases, with SoCal Citygate in Southern California rising by 12.5 cents from $3.58/MMBtu to $3.71/MMBtu, while PG&E Citygate in Northern California saw a 37-cent increase from $4.14/MMBtu to $4.51/MMBtu over the same period. This surge was partly influenced by ongoing maintenance in New Mexico, conducted by El Paso Natural Gas, which resulted in capacity constraints for westbound natural gas flows into Southern California. Extreme weather conditions, including a monthly high temperature of 117°F in the Phoenix Area of Arizona and above-average temperatures in the Riverside Area east of Los Angeles, led to increased cooling demand, with SoCal Citygate reaching $10.02/MMBtu on August 28. Conversely, in the Southeast, prices declined despite heightened natural gas consumption. FGT Citygate experienced a significant 93-cent drop, decreasing from $4.49/MMBtu last Wednesday to $3.57/MMBtu yesterday. This decrease coincided with Hurricane Idalia making landfall on August 30, resulting in widespread power outages in Florida and Georgia and subsequently decreasing demand for electric power generation. Notably, while prices fell at FGT Citygate, natural gas consumption across the broader Atlantic Coast region increased, driven by elevated temperatures that bolstered cooling demand. In the Atlantic Coast region, natural gas consumption in the electric power sector rose by 3% (0.2 Bcf/d) week over week, with total natural gas consumption also increasing by 2% (0.2 Bcf/d), as reported by S&P Global Commodity Insights (SPGCI).
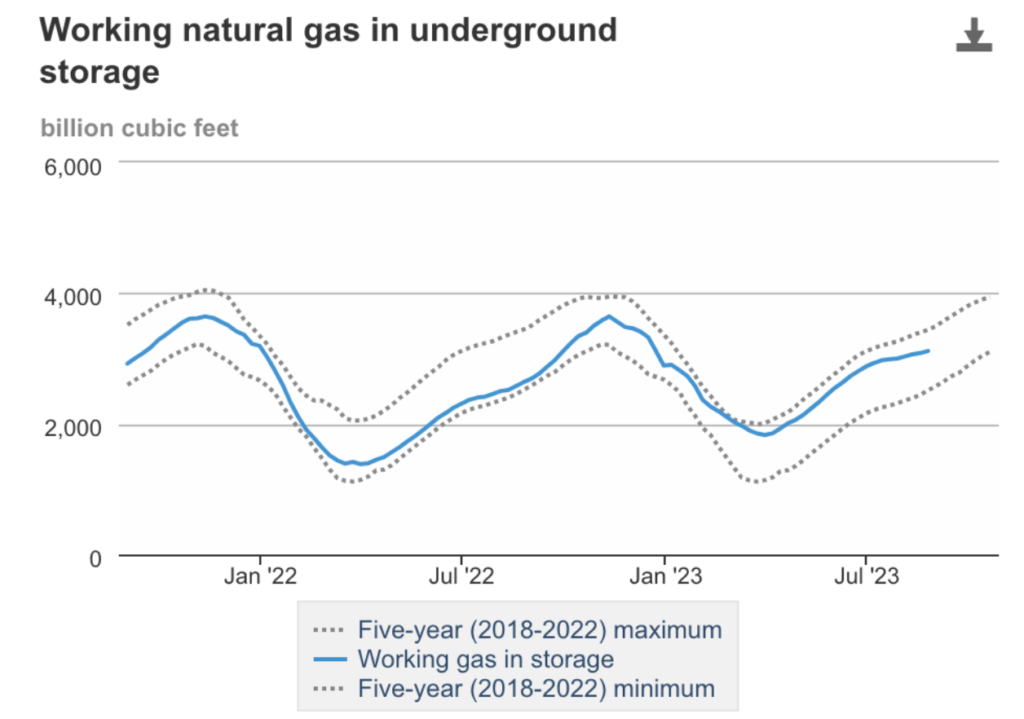
When it comes to supply, there was a slight increase in the total natural gas supply, rising by 0.2% (equivalent to 0.3 billion cubic feet per day, Bcf/d) compared to the data from the week of August 23rd. This growth, based on insights from SPGCI, can be attributed to a 0.3% growth (equivalent to 0.3 Bcf/d) in the production of dry natural gas, which reached a new weekly peak at an average of 102.8 Bcf/d. For the week ending August 25, net injections into natural gas storage amounted to 32 billion cubic feet (Bcf). This figure stands in contrast to the five-year average net injections of 51 Bcf and the previous year’s net injections of 61 Bcf for the same week. Presently, working natural gas stocks total 3,115 Bcf, marking an increase of 249 Bcf (9%) over the five-year average and a substantial 484 Bcf (18%) over the levels recorded at this time last year. Net injections have consistently lagged behind the five-year average for eight consecutive weeks. According to a survey conducted by The Desk among natural gas analysts, estimates for the weekly net change in working natural gas stocks ranged from net injections of 21 Bcf to 36 Bcf, with a median estimate of 31 Bcf.
It’s worth highlighting that the average rate of injections into storage during the refill season (April through October) is currently 4% lower than the five-year average. However, if the injection rate were to match the five-year average of 10.9 Bcf/d for the remainder of the refill season, the total inventory would reach 3,844 Bcf by October 31. This figure is notably 249 Bcf higher than the five-year average of 3,595 Bcf for that time of year.
Simultaneously, the average net imports from Canada experienced a minor decrease of 0.8% (just under 0.1 Bcf/d) when compared to the figures from the preceding week. The overall consumption of natural gas across the United States showed a marginal decrease of 0.1% (equivalent to 0.1 billion cubic feet per day, Bcf/d) in comparison to the previous week, based on SPGCI’s data. Natural gas usage for electricity generation experienced a slight increase of 0.1% (less than 0.1 Bcf/d) when assessed on a week-over-week basis. In the industrial sector, there was a 0.3% increase (0.1 Bcf/d) in consumption during the same period, while the residential and commercial sectors recorded a decline of 2.2% (0.2 Bcf/d). Notably, natural gas exports to Mexico registered a modest rise of 0.6% (less than 0.1 Bcf/d). Additionally, the deliveries of natural gas to U.S. liquefied natural gas (LNG) export facilities, as measured by LNG pipeline receipts, averaged 12.1 Bcf/d, marking a 0.3 Bcf/d rise compared to the preceding week.
In the realm of Liquefied Natural Gas (LNG), the average natural gas deliveries to U.S. LNG export terminals exhibited a notable increase of 2.6% (equivalent to 0.3 billion cubic feet per day, Bcf/d) on a week-over-week basis, reaching an average of 12.1 Bcf/d, as reported by SPGCI. This was particularly evident in deliveries to terminals in South Texas, which saw a 3.2% rise (0.1 Bcf/d) to reach 3.9 Bcf/d. Additionally, deliveries to terminals located in South Louisiana experienced a 2.9% increase (0.2 Bcf/d) to reach 7.2 Bcf/d and deliveries to terminals outside the Gulf Coast recorded a 2.0% decline, settling at 1.0 Bcf/d. Meanwhile, in terms of LNG vessel departures from U.S. ports, data from Bloomberg Finance, L.P. revealed that a total of twenty-three LNG vessels embarked from the United States between August 24 and August 30. These vessels hailed from various terminals, including seven from Sabine Pass, five from Freeport, four each from Cameron and Corpus Christi, two from Calcasieu Pass, and one from Cove Point, collectively boasting a combined LNG-carrying capacity of 86 Bcf.
In the Mid-Atlantic Region, forward power prices remained steady in the past week, reflecting the fluctuating NYMEX natural gas prices as summer peak season winds down. Calendar strips for electricity are currently 18% lower compared to last year and 22% lower than all-time highs, yet they remain 65% higher than all-time lows. Index prices in this region continue to be influenced by lower spot gas prices. In the Great Lakes Region, forward power prices also showed no significant changes as NYMEX natural gas prices exhibited similar fluctuations. Electricity calendar strips are presently 13% lower than last year and 20% lower than all-time highs, while remaining 60% higher than all-time lows. Index prices in this region are impacted by lower spot gas prices as well. Shifting to renewable energy, the US Bureau of Ocean Energy Management (BOEM) has granted approval for the construction of the 704-MW Revolution Wind project, set to supply 400 MW to Rhode Island utilities and 304 MW to Connecticut utilities, with full operation expected by 2025.
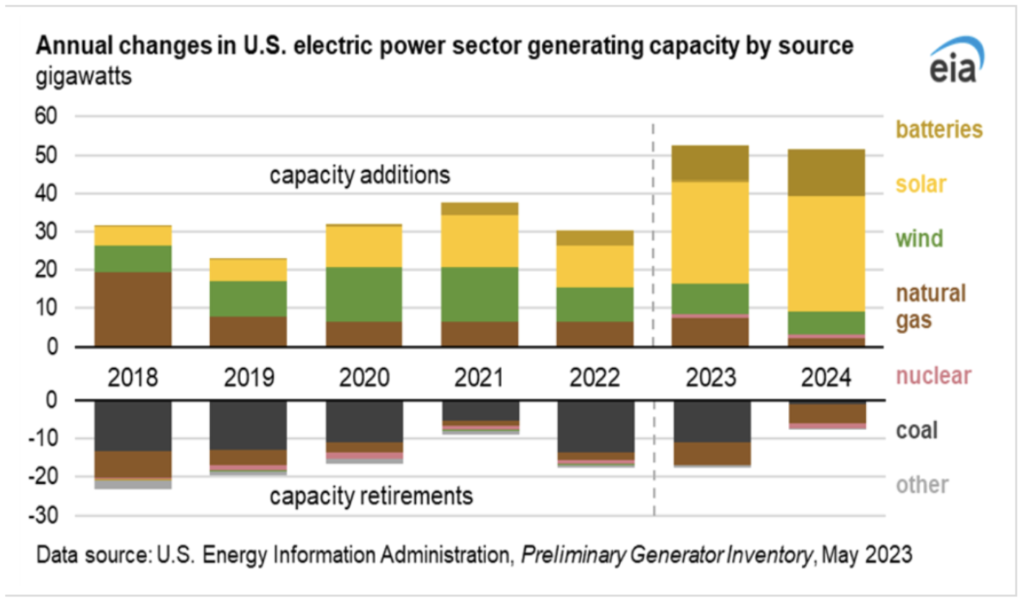
The energy sources used for electricity generation are primarily influenced by changes in the mix of generating capacity. Renewable energy capacity has been experiencing rapid growth, and this trend is expected to continue. The electric power sector has plans to add 27 gigawatts (GW) of new solar generating capacity by the end of 2023 and an additional 31 GW in 2024. Consequently, we anticipate that renewables, excluding hydropower, will make up 16% of total U.S. generation in 2023, up from 15% in 2022, and this share is projected to increase to 18% in 2024.
In contrast, approximately 15 GW of coal-fired capacity is scheduled for retirement by the close of 2023, resulting in a decrease in coal’s share to 16% of total U.S. generation this year and 15% in 2024, significantly lower than its 20% generation share in 2022. The forecast for natural gas generation shows an increase from 39% in 2022 to 42% in the current year, driven by low natural gas prices and the addition of 3 GW in natural gas-fired generating capacity. However, we anticipate the share of natural gas-fired generation to decline to 40% in 2024 due to the substantial influx of new renewable energy capacity, displacing natural gas. Additionally, a new 1.1 GW nuclear reactor in Georgia began operations in July, leading to a slight increase in U.S. nuclear generation for this year and a 2% rise in 2024, although the nuclear share of U.S. generation remains at 19%.
Furthermore, a 3% reduction is anticipated in coal production, declining from 597 million short tons (MMst) in 2022 to 578 MMst in 2023. Subsequently, coal production is projected to experience a significant 18% drop in 2024, reaching 472 MMst. These production declines are driven by a substantial reduction in coal consumption within the electric power sector, primarily due to ongoing coal plant retirements, increased utilization of natural gas for electricity generation owing to low natural gas prices, and the challenge of competing with solar generation, which incurs zero marginal dispatch cost.
While the majority of U.S. coal production is consumed domestically, there has been a notable increase in exports, accounting for 17% (50 MMst) of production in the first half of 2023 (1H23), up from 15% (44 MMst) in 1H22. We anticipate this export share to further rise to 22% of production in 2024, totaling 103 MMst for the entire year. This shift is attributed to reduced domestic coal usage and sustained overseas demand. The suspension of Europe’s coal purchases from Russia since August 2022 has significantly boosted U.S. exports of thermal coal to Europe, effectively doubling over the past 18 months. Given these circumstances, F&D Partners anticipates that prices will notably increase, particularly in the years 2025-2026.
F&D Partners was very successful in navigating one of the most volatile years in the energy markets by helping our clients save tremendously.
Contact us today for the newest strategies in the energy markets for 2023, 2024 and 2025.