

As winter approaches, natural gas prices are on the rise, creating an enticing market dynamic. The Henry Hub spot price declined by 6 cents, moving from $2.77 per million British thermal units (MMBtu) on September 20th to $2.71/MMBtu on September 27th. Within the context of Henry Hub futures prices, the October 2023 NYMEX contract concluded at $2.764/MMBtu upon its expiration on September 27th, reflecting a 3-cent increase compared to September 20th. Meanwhile, the price of the November 2023 NYMEX contract, symbolizing the initial month for winter heating season gas sales, decreased to $2.899/MMBtu, down by 2 cents from September 20th to September 27th. In addition, the value of the 12-month strip, encompassing futures contracts from November 2023 to October 2024, experienced a 1-cent reduction, settling at $3.220/MMBtu on September 27th.
Natural gas prices at major pricing hubs displayed a varied pattern during the week from September 20th to September 27th, with declines occurring at the Henry Hub and Western hubs, while Eastern hubs recorded price increases. The changes ranged from a significant $1.15/MMBtu drop at SoCal Citygate to a promising $0.27/MMBtu rise at Eastern Gas South near Pittsburgh, Pennsylvania. Western markets experienced price declines, with all major hubs, except PG&E Citygate in Northern California, falling below the $3.00/MMBtu mark. The price at PG&E Citygate in Northern California decreased by 29 cents, while in Southern California’s SoCal Citygate, prices dropped significantly by $1.15. We know these natural gas prices are determined by supply and demand.
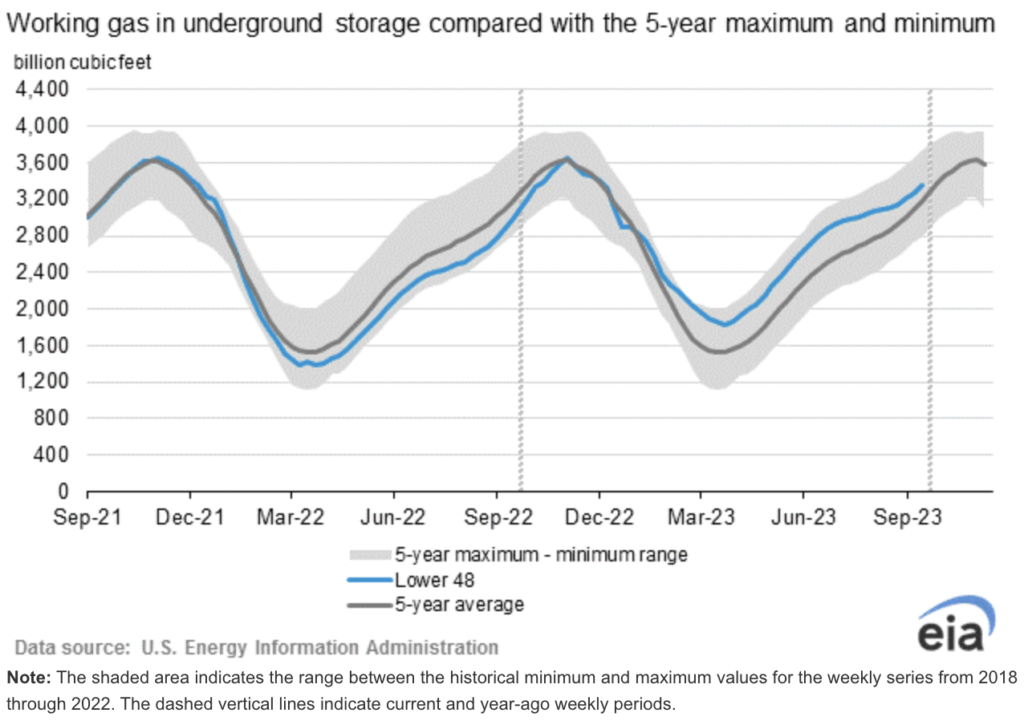
On the supply front, data from S&P Global Commodity Insights reveals that the average total supply of natural gas experienced a slight increase of 0.1% (0.1 Bcf/d) during the week ending September 27th when compared to the week ending September 20th. Dry natural gas production remained steady, maintaining an average of 101.2 Bcf/d, while average net imports from Canada saw a 2.0% (0.1 Bcf/d) uptick from the prior week. Furthermore, net injections into storage amounted to 90 Bcf for the week ending September 22nd, a figure that surpassed both the five-year (2018–2022) average net injections of 84 Bcf and last year’s net injections of 103 Bcf during the same week. As a result, working natural gas stocks reached 3,359 Bcf, which stands 6% higher than the five-year average and 13% greater than last year at this time. According to The Desk survey of natural gas analysts, estimates for the weekly net change to working natural gas stocks ranged from net injections of 84 Bcf to 102 Bcf, with a median estimate of 90 Bcf. It’s worth noting that the average rate of injections into storage has been 7% lower than the five-year average throughout the refill season, spanning from April through October. If this rate were to match the five-year average of 10.9 Bcf/d for the remainder of the refill season, the total inventory would reach 3,784 Bcf by October 31st, exceeding the five-year average of 3,595 Bcf for that time of year by 189 Bcf.
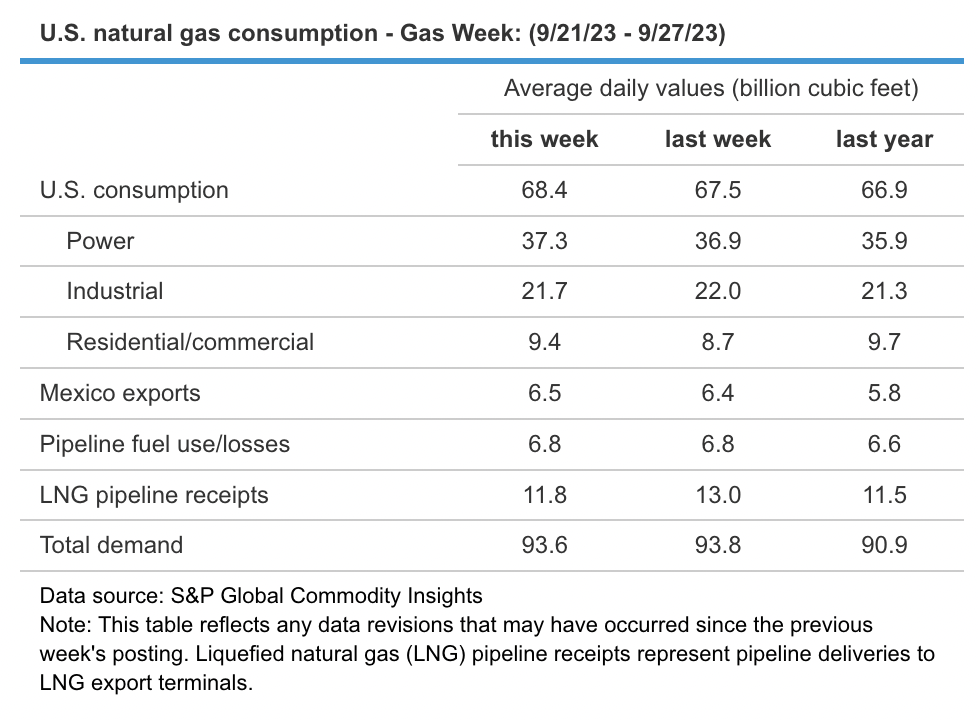
The demand side of the natural gas market experienced notable fluctuations during the week, with total U.S. consumption showing a 1.3% increase of 0.9 Bcf/d compared to the prior report week, as reported by S&P Global Commodity Insights. Specifically, natural gas consumption for power generation rose by 1.2% (0.4 Bcf/d), while industrial sector consumption decreased by 1.0% (0.2 Bcf/d). A striking surge of 7.4% (0.6 Bcf/d) in residential and commercial sector consumption was observed, driven by a surge in demand attributed to below-average temperatures in the Northeast region. This weather-induced surge led to price escalations, with Algonquin Citygate, serving Boston, witnessing a 15-cent increase, and New York-Central Park Area prices rising by 20 cents. Moreover, Texas experienced a 4% increase (0.5 Bcf/d) in natural gas consumption, propelled primarily by a significant 9% (0.6 Bcf/d) upswing in electric power sector consumption. These shifts were directly influenced by temperature variations, with the Houston Area experiencing an average temperature of 85°F during the week, resulting in 142 cooling degree days (CDDs), surpassing both the previous week and the typical average by 25 CDDs and 47 CDDs, respectively.
Additionally, natural gas exports to Mexico increased by 1.5% (0.1 Bcf/d), while natural gas deliveries to U.S. LNG export facilities showed a 9.1% decrease (1.2 Bcf/d) week over week, averaging 11.8 Bcf/d, with declines observed in South Louisiana and South Texas deliveries. Furthermore, deliveries to terminals outside the Gulf Coast decreased significantly by 67.6% (0.6 Bcf/d) to 0.3 Bcf/d, and the Cove Point LNG terminal in Maryland temporarily halted operations for annual maintenance. In terms of LNG vessel departures from U.S. ports, a total of 21 LNG vessels with a combined carrying capacity of 79 Bcf set sail between September 21st and September 27th, reflecting the dynamic nature of the natural gas market.
In the Mid-Atlantic Region, forward power prices increased by 2% over the past week due to natural gas market dynamics. The NYMEX prompt-month contract received late-day price support nearing its Wednesday expiration, and Nov’23 took over as the new prompt-month contract at a higher rate. This shift aligns with the current period of simultaneous cooling and heating demand, prompting price adjustments based on short-term temperature forecasts. The forward price curve from 2024 to 2028 has, on average, decreased by 14% compared to the previous year, marking a 22% decline from its all-time highs, yet it remains substantially higher, with a 65% increase from the all-time lows. Monthly settlement prices for September in the West Hub averaged $31.93/MWh, a 6% increase from August, while East Hub prices settled at $26.03/MWh, reflecting a marginal 1% decrease from the previous month’s average. In the Great Lakes Region, forward power prices also increased by 2% in the past week, driven by natural gas market movements. The forward price curve for 2024 to 2028 has seen an average decrease of 11% compared to the previous year, and it is 19% lower than its historical highs for that term, while still maintaining a notable 62% increase from the all-time lows. In terms of monthly settlement prices, COMED recorded an average of $27.54/MWh for September, marking a 7% decrease from August, while AdHub prices settled at $29.37/MWh, reflecting a modest 2% decline from the prior month’s average. Michigan’s September settlement price averaged $31.10/MWh, a substantial 61% decrease from August, while Ameren’s final settlement price for September averaged $30.54/MWh, representing a notable 64% decrease from August’s monthly average.
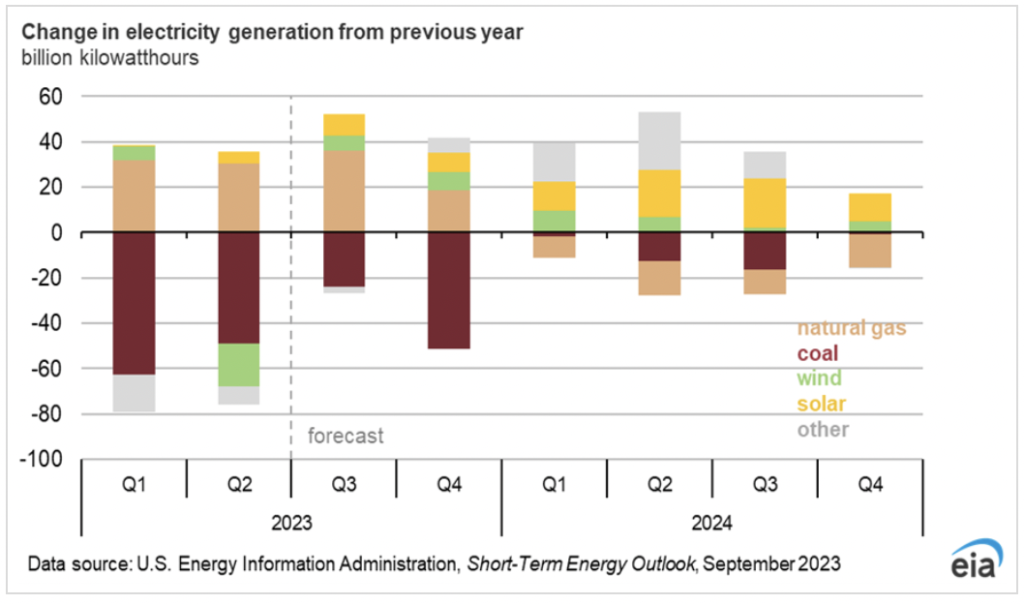
EIA predicted that elevated temperatures across much of the nation during the summer raised U.S. electricity generation by about 2% during the third quarter of 2023 (3Q23) compared to 3Q22. This increase came after relatively low electricity demand in the first half of 2023 had reduced generation by 4%. U.S. natural gas-fired power plants were anticipated to generate a record of more than 1,700 billion kilowatthours (kWh) in 2023, marking an increase of 7% from 2022. Increased U.S. natural gas generation was stimulated by a substantial decline in fuel costs, which EIA has forecasted to average near $3.30 per million British thermal units (MMBtu) in 2023, down more than 50% from 2022. The addition of between 8 gigawatts (GW) and 9 GW of new natural gas-fired generating capacity in that year also contributed to the increased generation. Although natural gas-fired generation was expected to remain the main source of U.S. electricity in 2024, EIA projects that it will decline by 3% in 2024 due to increased generation from renewable energy sources.
Renewable energy sources, notably solar and wind, have steadily gained prominence in the landscape of U.S. electricity generation over the past several years. While their growth trajectory had been impressive, it encountered a temporary slowdown in 2022 compared to the preceding year, primarily due to challenges stemming from supply chain disruptions that resulted in increased costs. Nevertheless, the renewable energy sector has rebounded vigorously in 2023, buoyed by a confluence of factors that have set the stage for significant expansion.
The catalyst for this resurgence lies in the favorable financial incentives that have been strategically put in place, catalyzing remarkable strides in utility-scale solar capacity. As we look ahead, the forecast for 2023 projects a robust addition of 26 gigawatts (GW) of solar capacity, followed by an even more substantial leap in 2024, with an anticipated installation of 33 GW. These projections mark a monumental milestone, positioning 2024 as a pivotal year that is poised to shatter records as the most prolific period for solar installations in history. It’s also important to note that renewable capacity expansions tend to exhibit a cyclical pattern, with a propensity to materialize towards the culmination of the calendar year. This temporal pattern carries profound implications for the subsequent year’s electricity generation landscape. Building on this insight, EIA’s forecast anticipates a remarkable surge in U.S. generation from renewables, excluding hydropower. In 2023, it is expected to witness an upswing of 22 billion kilowatthours (kWh), signifying a 4% increase. Looking further ahead to 2024, the projections soar even higher, with an impressive 91 billion kWh increment, marking a substantial 14% surge.
F&D Partners was very successful in navigating one of the most volatile years in the energy markets by helping our clients save tremendously.
Contact us today for the newest strategies in the energy markets for 2023, 2024 and 2025.