

Over the past week, there have been notable changes in price in the energy markets. On October 25th, the Henry Hub spot price was $2.86 per million British thermal units (MMBtu). On November 1st, it increased by 33 cents to $3.19/MMBtu. The November 2023 NYMEX contract ended the week at $3.164/MMBtu in the futures market, up 15 cents from the week before. In a similar vein, the December 2023 NYMEX contract price demonstrated tenacity, rising by 12 cents between October 25 and November 1 to reach $3.494/MMBtu. Additionally, there was a 12 cent increase in the 12-month strip price, which averages futures contracts from December 2023 to November 2024, bringing it to $3.505/MMBtu.
Because of the market’s dynamic nature, natural gas spot prices have fluctuated over the last week of October in a variety of geographical areas. Notably, PG&E Citygate experienced a significant decrease of $1.84/MMBtu, while SoCal Citygate saw an increase of $2.02/MMBtu, illustrating the market’s inherent volatility. In the Northeast, prices rose, although they remain among the lowest in North America. Algonquin Citygate, serving Boston, saw a noteworthy increase of $1.61, and the Transcontinental Pipeline Zone 6 point for New York City recorded a 97-cent rise. This price surge in the Northeast was driven by a 9% increase in natural gas consumption, with a 9% rise in electric power sector consumption meeting cooling demand early in the week and a 14% increase in residential and commercial sector consumption to satisfy heating demand as temperatures fluctuated. Meanwhile, in the Midwest, the Chicago Citygate price surged by 68 cents, reaching a weekly high, primarily due to a 100% increase in consumption in the residential and commercial sector, driven by colder weather. On the West Coast, price changes were mixed, with Northwest Sumas falling by $1.59, PG&E Citygate dropping $1.84, and SoCal Citygate increasing $2.02. Notable factors influencing these shifts included fluctuations in net flows of natural gas into the Pacific Northwest and maintenance by SoCal Gas.
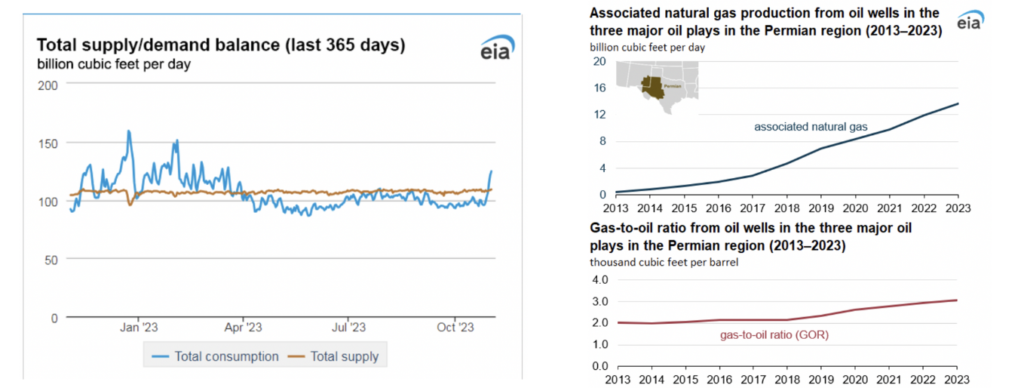
Data from S&P Global Commodity Insights showed that the total amount of natural gas consumed in the US increased by a strong 16.1%, or 11.3 billion cubic feet per day (Bcf/d), where 9.2 Bcf/d (9.8% increase) was from the consumption in the residential and commercial sectors. Additionally, as a result of rising demand, natural gas consumption for power generation increased noticeably by 3.5% (1.1 Bcf/d) week over week. A similar trend was seen in the industrial sector, where consumption increased by 4.4% (1.0 Bcf/d).
In the supply sector, data from S&P Global Commodity Insights reveals that the average total supply of natural gas experienced a slight decline, decreasing by 0.2% (0.2 Bcf/d) in comparison to the preceding report week. This change primarily stemmed from a 0.5% drop (0.5 Bcf/d) in dry natural gas production, resulting in a weekly average of 102.4 Bcf/d. Conversely, average net imports from Canada increased by 5.3% (0.3 Bcf/d) when compared to the previous week. As for storage dynamics, net injections into storage reached 79 Bcf for the week ending October 27, a noteworthy difference from the five-year (2018–2022) average net injections of 57 Bcf and last year’s net injections of 99 Bcf during the corresponding week. Consequently, working natural gas stocks totaled 3,779 Bcf, surpassing the five-year average by 205 Bcf (6%) and exceeding last year’s levels by 293 Bcf (8%) at this time.
In line with these figures, natural gas analysts participating in The Desk survey estimated a range of weekly net changes to working natural gas stocks, spanning from net injections of 76 Bcf to 85 Bcf, with a median estimate of 81 Bcf. On the other hand, natural gas production in the top three Permian oil plays—the Wolfcamp, Spraberry, and Bone Spring formations—has changed significantly since 2018. The Permian is a vital contributor to U.S. energy, ranking first in crude oil and second in natural gas production. The surge in associated natural gas production in these plays can be attributed to two pivotal factors: the increased GOR and the greater crude oil production. Approximately 4.7 Bcf/d of the increased production can be attributed to the higher GOR compared to 2013, while the remaining 9.0 Bcf/d of increased production is due to the expanded crude oil production in the Permian region. The natural progression of GOR in oil wells is driven by the gradual release of natural gas as the pressure within the reservoir decreases with increased oil extraction. As more oil and natural gas are extracted within a well, the GOR naturally tends to increase, leading to a higher volume of associated natural gas production per barrel of oil.
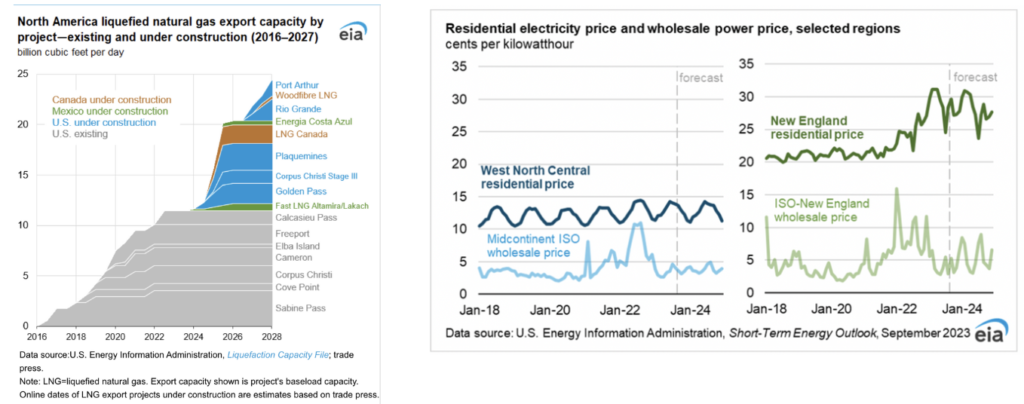
Anticipated growth in North American liquefied natural gas (LNG) exports is on the horizon, driven by new ventures. Over the next five years, it is projected that North America’s LNG export capacity will increase by 12.9 billion cubic feet per day (Bcf/d). This expansion will occur as Mexico and Canada introduce their inaugural LNG export facilities, alongside the United States, which is adding to its existing 11.4 Bcf/d LNG capacity. By the conclusion of 2027, it is estimated that LNG export capacity will see growth by 1.1 Bcf/d in Mexico, 2.1 Bcf/d in Canada, and 9.7 Bcf/d in the United States, facilitated by ten new projects across the three countries.
In Mexico, there are three projects currently under construction. These projects are expected to collectively yield an LNG export capacity of 1.1 Bcf/d. They encompass Fast LNG Altamira (offshore and onshore), Fast LNG Lakach (offshore), and Energia Costa Azul (with a capacity of 0.4 Bcf/d for Phase 1 and 1.6 Bcf/d for Phase 2). These ventures will utilize natural gas sourced from the United States. While the offshore unit of Fast LNG Altamira is expected to commence LNG exports in December 2023, the onshore units are scheduled for 2025. Fast LNG Lakach anticipates its first LNG exports in 2026. Additionally, developers have proposed other LNG export projects for Mexico’s west coast, with a combined capacity exceeding 2.7 Bcf/d, targeting Asian markets.
In Canada, two LNG export projects with a combined capacity of 2.1 Bcf/d are under construction in British Columbia on the west coast. These projects are LNG Canada (1.8 Bcf/d) and Woodfibre LNG (0.3 Bcf/d), with anticipated service commencement in 2025 and 2027, respectively. Both export terminals will be supplied with natural gas from western Canada. Furthermore, the Canada Energy Regulator (CER) has granted authorization for an additional 18 LNG export projects, boasting a combined capacity of 29 Bcf/d.
In the United States, five LNG export projects are currently under construction, aiming to provide a total of 9.7 Bcf/d in LNG export capacity. These projects include Golden Pass, Plaquemines, Corpus Christi Stage III, Rio Grande, and Port Arthur, with LNG exports from Golden Pass LNG and Plaquemines LNG expected to commence in 2024. It is evident that this situation will inevitably drive up natural gas prices, consequently impacting the cost of power. In light of this, F&D Partners strongly advises opting for an all in-fixed rate for natural gas as soon as possible.
When it comes to electricity, in the Mid-Atlantic Region, forward power prices saw a modest uptick in the past week, primarily due to colder weather forecasts and a rally in natural gas prices, which lent support to overall energy prices. Natural gas prices saw an increase in four out of five trading sessions last week, influenced by a combination of factors such as weather conditions, contract expirations for November 2023, and decreased trading volumes in the market. Looking at power forwards for the 2024-2028 term in this region, prices inched up by 1% along the price curve. Over the past month, these prices climbed by 4%, but they remain 7% lower compared to the same period last year. Examining recent trends, the month-to-date average day-ahead settlement price in the West Hub stands at $37.07 per megawatt-hour (MWh), representing a 16% increase over the September average but a notable 61% decrease when compared to last year’s figures.
Meanwhile, in the Great Lakes Region, power forwards in the 2024-2028 term in the Great Lakes Region, prices remained unchanged across the price curve over the past week. Over the course of the past month, these prices increased by 4%, but they are 5% lower when compared to the same period last year. Looking at the month-to-date average day-ahead monthly settlement price, COMED recorded $30.23/MWh, marking a 10% increase over the September average but showing a substantial 54% decline compared to last year. In AdHub, the average stood at $34.99/MWh, reflecting a 19% increase from last month but a 40% decrease compared to the same time last year.
In Michigan, the settlement price for October thus far is $32.67/MWh, demonstrating a 4% increase compared to the previous month but a 38% decline when compared to the September monthly average. On the other hand, Ameren reported a monthly settlement price of $32.67/MWh, marking a 5% increase month-over-month but a 39% decrease compared to the previous year.
F&D Partners was very successful in navigating one of the most volatile years in the energy markets by helping our clients save tremendously.
Contact us today for the newest strategies in the energy markets for 2023, 2024 and 2025.