

The first week of November, U.S. natural gas futures experienced a 2% decline, reaching a two-week low amid record output and forecasts predicting mild weather through late November. This downturn was reflected in the front-month gas futures for December delivery on the New York Mercantile Exchange, which fell by 6.5 cents or 2.15%, settling at $3.041 per million British thermal units (mmBtu). The market’s movement was influenced by the anticipation of limited heating demand due to the mild weather, allowing utilities to continue injecting gas into storage for a couple more weeks. This trend coincided with the Henry Hub spot price, which fell by 2 cents from $2.72 to $2.70/MMBtu by November 27th, while the Henry Hub futures prices saw declines, with the December 2023 NYMEX contract expiring at $2.706/MMBtu, down 19 cents from the previous Wednesday. Additionally, the January 2024 NYMEX contract and the 12-month strip, averaging January 2024 through December 2024 futures contracts, both recorded decreases, contributing to the overall dynamics in the natural gas market.
During the reporting week from Wednesday, November 22 to Wednesday, November 29, natural gas spot prices demonstrated varied movements across different locations. Notably, the Algonquin Citygate experienced a decline of $1.23/MMBtu, reaching $3.50/MMBtu, while Northwest Sumas saw an increase of $2.00/MMBtu. In the Northeast, price changes exhibited a mixed pattern. The Algonquin Citygate, serving the Boston area, observed a decrease from $4.73/MMBtu to $3.50/MMBtu. Conversely, at the Transcontinental Pipeline Zone 6 trading point for New York City, the price increased by 4 cents, reaching $2.49/MMBtu from $2.45/MMBtu during the same time period. The Algonquin Citygate recorded a weekly high of $10.15/MMBtu on November 26th due to colder weather in the region, with Boston Area temperatures averaging 39°F and generating 183 heating degree days (HDDs), marking an increase of 42 HDDs compared to the previous week. It is worth mentioning that natural gas consumption in New England surged by 16% (0.4 billion cubic feet per day [Bcf/d]), driven by a 35% (0.5 Bcf/d) rise in residential and commercial sector consumption to meet elevated demand for space heating. Since October 20, the Millstone nuclear power station in Waterford, Connecticut, operated at around 40% of capacity, contributing to increased natural gas consumption for electric power generation to compensate for lower nuclear power-generation capacity.
In the Midwest, the Chicago Citygate price remained unchanged at $2.55/MMBtu despite a substantial 32% (4.9 Bcf/d) increase in natural gas consumption. Residential and commercial sector consumption surged by 60% (4.2 Bcf/d) week over week, attributed to temperatures in the Chicago Area averaging 29°F, which was 8°F below normal and resulted in 249 HDDs—109 HDDs more than the previous week and 51 HDDs more than normal. Natural gas storage inventories in the Midwest totaled 1,111 billion cubic feet for the week ending November 24, marking a 6.5% increase compared to year-ago levels and a 6.7% rise compared to the five-year (2018–2022) average. Additionally, net natural gas flows into the Mid-Continent region, originating from Canada, the Rocky Mountain region, and the Northeast region, increased by 3% (0.3 Bcf/d), according to data from S&P Global Commodity Insights.
On the West Coast, prices experienced an upward trend. The PG&E Citygate in Northern California saw a rise of $1.26, reaching $6.16/MMBtu from $4.90/MMBtu. Similarly, the SoCal Citygate in Southern California increased by $1.93, climbing to $6.19/MMBtu from $4.26/MMBtu the previous Wednesday. In California, natural gas consumption increased by 13% (0.7 Bcf/d). Temperatures in the Sacramento Area averaged 50°F, resulting in 105 HDDs, an increase of 36 HDDs compared to the previous week. Moreover, at Northwest Sumas on the Canada-Washington border, prices surged by $2.00, reaching $5.87/MMBtu from $3.87/MMBtu last Wednesday. Natural gas consumption in the Pacific Northwest increased by 23% (0.6 Bcf/d), with temperatures in the Seattle-Tacoma Area averaging 38°F and generating 189 HDDs, 42 HDDs more than the previous week. Additionally, maintenance on the Gas Transmission Northwest pipeline reduced available pipeline capacity by approximately 0.7 Bcf/d for natural gas deliveries into the Pacific Northwest.
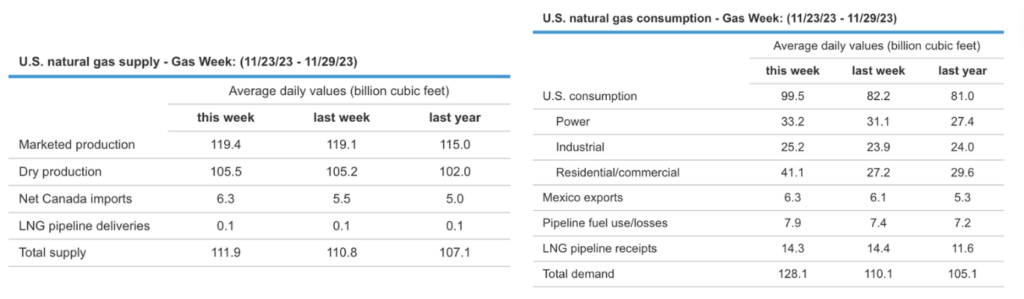
During this whole period, the overall consumption of natural gas in the United States surged by 21.0% (17.3 Bcf/d). A notable spike of 50.8% (13.8 Bcf/d) in consumption was observed in the residential and commercial sectors, driven by the onset of colder weather sweeping across the nation. The demand for natural gas for power generation also experienced a week-over-week increase of 6.7% (2.1 Bcf/d), while the industrial sector saw a rise of 5.5% (1.3 Bcf/d) in consumption. Additionally, there was a 4.0% uptick (0.2 Bcf/d) in natural gas exports to Mexico. Meanwhile, deliveries to U.S. LNG export facilities, as indicated by LNG pipeline receipts, averaged 14.3 Bcf/d, showing a marginal decrease of 0.1 Bcf/d compared to the previous week.
On the supply side, the collective supply of natural gas exhibited a 1.0% increase (1.1 Bcf/d) compared to the preceding week (November 22nd). Notably, dry natural gas production saw a growth of 0.3% (0.3 Bcf/d), reaching a weekly average of 105.5 Bcf/d. Concurrently, average net imports from Canada experienced a substantial rise of 14.5% (0.8 Bcf/d) from the previous week. Throughout November, U.S. dry natural gas maintained an average above 105 Bcf/d, indicating a 2.5% uptick (2.6 Bcf/d) from October. This increase was attributed to the growth in production observed in the Appalachian and Permian regions, as well as the Cana-Woodford basin in Oklahoma. The latest estimates from the EIA indicate a projected increase in dry gas production, reaching 103.68 billion cubic feet per day (bcf/d) in 2023 and further advancing to 105.12 bcf/d in 2024. This marks an ascent from the previous record of 99.60 bcf/d recorded in 2022, although the agency’s current forecasts represent a slight downward revision from its October predictions of 103.72 bcf/d for supply.
In addition to the production outlook, the EIA anticipates a trajectory in domestic gas consumption. The forecast suggests a rise from the 2022 record of 88.38 bcf/d to 89.42 bcf/d in 2023, followed by a moderate decline to 89 bcf/d in 2024. Notably, the October forecast for 2023 had initially indicated a slightly higher demand at 89.17 bcf/d.
If these projections materialize, it would signify the first instance of a four-year consecutive rise in output since 2015. Furthermore, 2023 would mark the first time in three consecutive years that demand has shown an upward trend since 2016.
In the previous week of November 2023, there has been a continual softening of forward power prices in the Great Lakes Region, a trend influenced by the ongoing decline in NYMEX natural gas forward prices. This descent is attributed to a combination of abundant supply and diminished demand projections as winter commences. Despite the anticipation of cold fronts sweeping across the eastern two-thirds of the nation in the coming week to the extended holiday period, the market appears resilient, leaning towards forecasts predicting milder temperatures in December.
Power forwards for the 2024-2028 term in the Great Lakes Region witnessed a 1% decrease over the past week and a 2% decrease over the past month. Year-over-year forward prices depict a substantial decline, with a 29% decrease for 2024 and an 11% decrease for 2027-2028. Examining the month-to-date, the day-ahead settlement price for November in Michigan stands at $32.52/MWh, remaining consistent with last month’s settlement price average but registering a notable 36% decrease compared to the same period last year. Similarly, Ameren records an average of $30.78/MWh, reflecting a 3% decrease month-over-month and a significant 36% decrease compared to November 2022. Simultaneously, in the Mid-Atlantic Region, there has been a parallel trend of softening forward power prices over the past week, In the Mid-Atlantic region, power forwards for the 2024-2028 term experienced a 1% decrease over both the past week and the past month. Notably, year-over-year forward prices exhibit a significant decline, with a 30% decrease for 2024 and a 14% decrease for 2026-2028. Examining the month-to-date, the average day-ahead settlement price for November in West Hub stands at $38.23/MWh. Although this represents a modest 3% increase compared to last month’s settlement price average, it signifies a substantial 41% decrease compared to the same period last year in November.
Power prices exhibit a strong correlation with natural gas prices. Current favorable conditions in the international natural gas market are propelling an upswing in U.S. LNG exports, driven by relatively higher natural gas prices in Europe and Asia compared to the U.S. Forecasts from our Short-Term Energy Outlook predict ongoing displacement of Russian pipeline exports to Europe by U.S. LNG, especially considering the limited growth in global LNG export capacity over the next two years. The demand for flexible LNG, primarily sourced from the U.S., is expected to intensify in response to incremental global demand.
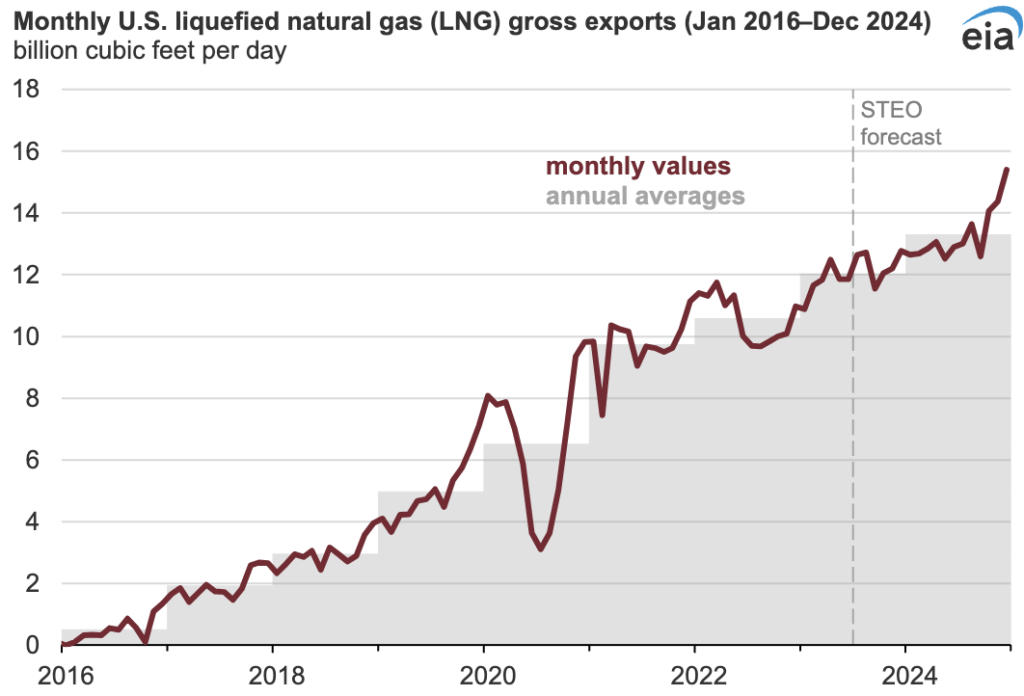
Projections indicate that U.S. LNG exports will average 12.0 billion cubic feet per day (Bcf/d) in 2023, with a further increase to 13.3 Bcf/d in 2024 due to the commencement of two new LNG export projects. Nominal capacity, reflecting standard operating conditions, is expected to reach 105% in 2023 and 108% in 2024, equivalent to 88% and 90% of peak capacity, respectively. The heightened utilization of nominal and peak capacity underscores the robust demand for U.S. LNG in the international market.
Notably, U.S. LNG exporters used 98% of their nominal capacity in 2022, impacted by the Freeport LNG facility outage in Texas and the ramp-up period of the new Calcasieu Pass LNG export facility in Louisiana. Anticipating increased demand, we expect U.S. LNG exporters to utilize 105% of nominal capacity in 2023 and 108% in 2024. Despite uncertainties related to the start-up timelines of the two new U.S. LNG export projects, we foresee them coming online by the end of 2024 based on public announcements and regulatory filings. This surge in LNG exports positions the U.S. as a key player in meeting growing global demand, contributing to expectations of higher natural gas prices driven by heightened international demand. Consequently, we anticipate a corresponding increase in power prices.
F&D Partners was very successful in navigating one of the most volatile years in the energy markets by helping our clients save tremendously.
Contact us today for the newest strategies in the energy markets for 2023, 2024 and 2025.