

U.S. Henry Hub natural gas prices in 2023 were the lowest since mid-2020!
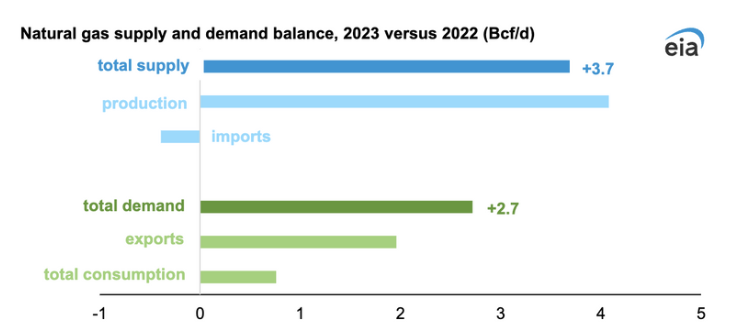
In 2023, the U.S. benchmark Henry Hub natural gas price averaged $2.57 per million British thermal units (MMBtu), representing a substantial 62% drop from the average annual price in 2022. The decline was attributed to record-high natural gas production, stagnant consumption levels, and increasing inventories throughout the year. With the monthly average Henry Hub price consistently below $3.00/MMBtu, except for January, the lowest monthly average was recorded in May at $2.19/MMBtu. The primary driver of the price decrease in 2023 was the record-high natural gas production, estimated at 104 billion cubic feet per day (Bcf/d) according to the December Short-Term Energy Outlook, marking a 4% increase from the 2022 annual average. This surge in production was particularly notable in the Permian, Haynesville, and Appalachia regions. Warmer temperatures during the peak heating season in January and February 2023 led to reduced consumption in residential and commercial sectors, resulting in the lowest total U.S. natural gas consumption for those months in seven years. Despite this, overall natural gas demand saw a 3% increase in 2023 compared to 2022, driven by rising exports, including a 12% increase in liquefied natural gas exports and a 9% increase in natural gas exports by pipeline.
On December 20th, the Henry Hub spot price exhibited a notable uptick, rising by 16 cents from its previous standing at $2.33 per million British thermal units (MMBtu) to reach $2.49/MMBtu. Concurrently, the Henry Hub futures prices witnessed upward movements. Specifically, the January 2024 NYMEX contract experienced a rise of 11.2 cents, escalating from $2.335/MMBtu on the aforementioned Wednesday to $2.447/MMBtu by the close of the recent trading day. Additionally, the 12-month strip, representing the average of futures contracts spanning January 2024 through December 2024, demonstrated a slight increase, settling at $2.564/MMBtu. These fluctuations in both spot and futures prices highlight the dynamic nature of the energy market,
More specifically, during the report week spanning from Wednesday, December 13, to Wednesday, December 20, natural gas spot prices experienced notable fluctuations across various locations. The range of price changes was diverse, ranging from an 88-cent decrease at the SoCal Citygate to a significant $2.02 increase at the Algonquin Citygate. In the Northeast, heightened demand due to a drop in temperatures towards the end of the report week propelled price increases. Specifically, at the Algonquin Citygate, serving Boston-area consumers, the price surged by $2.02, climbing from $3.39/MMBtu to $5.41/MMBtu. Meanwhile, at the Transcontinental Pipeline Zone 6 trading point for New York City, prices rose by 38 cents, moving from $2.14/MMBtu to $2.52/MMBtu. Despite a 2°F increase in weekly average temperatures in the Boston Area, temperatures dropped, contributing to a shift in natural gas consumption patterns. In the Northeast, weekly average consumption in the residential and commercial sectors increased by 1.2% (0.2 Bcf/d) during the same period, according to data from S&P Global Commodity Insights. In the Pacific Northwest, the pricing point at Northwest Sumas on the Canada-Washington border saw an increase from $1.12/MMBtu the week of December 13th to $2.72/MMBtu on Wednesday, December 20th. Notably, electric power sector consumption of natural gas in the Pacific Northwest surged by 9.8% (0.1 Bcf/d) during the same period of time. On the other hand at PG&E Citygate in Northern California, the price fell by 55 cents, dropping from $4.21/MMBtu the previous Wednesday to $3.66/MMBtu the upcoming one. Similarly, the price at SoCal Citygate in Southern California decreased by 88 cents, reaching $3.43/MMBtu from $4.31/MMBtu the previous Wednesday. Warmer temperatures in the Riverside Area, inland from Los Angeles, contributed to a 17.9% decrease (0.5 Bcf/d) in natural gas consumption in the residential and commercial sectors.
As per data provided by S&P Global Commodity Insights, the average total supply of natural gas observed a 0.6% increase (0.7 Bcf/d) in comparison to the previous report week. Dry natural gas production experienced a growth of 0.6% (0.6 Bcf/d), reaching a weekly average record high of 105.8 Bcf/d. Concurrently, average net imports from Canada saw a 2.2% increase (0.1 Bcf/d) from the preceding week. Net withdrawals from storage for the week ending December 15 amounted to 87 Bcf, deviating from the five-year (2018–2022) average net withdrawals of 107 Bcf and last year’s net withdrawals of 82 Bcf for the same week. The working natural gas stocks totaled 3,577 Bcf, surpassing the five-year average by 280 Bcf (8%) and exceeding last year’s levels by 240 Bcf (7%). Insights from The Desk survey of natural gas analysts indicated varied estimates for the weekly net change to working natural gas stocks, ranging from net withdrawals of 73 Bcf to 96 Bcf, with a median estimate of 82 Bcf.
When it comes to the demand, the total U.S. consumption of natural gas witnessed a modest 0.3% increase (0.3 Bcf/d) compared to the preceding report week. Within this overall trend, natural gas consumption for power generation recorded a marginal 0.1% rise (less than 0.1 Bcf/d) week over week. The industrial sector experienced a slight decrease in consumption, contracting by 0.5% (0.1 Bcf/d). On the other hand, the residential and commercial sectors registered a 1.1% increase (0.4 Bcf/d) in consumption during the same period. In the realm of Liquefied Natural Gas (LNG), data from S&P Global Commodity Insights reveals that the average deliveries to U.S. LNG export terminals remained relatively stable, maintaining an unaltered average of 14.6 Bcf/d week over week. Noteworthy regional variations include a 1.0% decrease (0.1 Bcf/d) in natural gas deliveries to terminals in South Louisiana, which settled at 9.1 Bcf/d. Conversely, terminals in South Texas experienced a 2.0% increase (0.1 Bcf/d) in deliveries, reaching 4.3 Bcf/d, while terminals outside the Gulf Coast saw no significant change, holding steady at 1.2 Bcf/d. Natural gas exports to Mexico also decreased by 2.1% (0.1 Bcf/d). Additionally, shipping data from Bloomberg Finance, L.P., indicates that between December 14 and December 20, a total of twenty-two LNG vessels, distributed among various U.S. terminals, departed with a combined LNG-carrying capacity of 82 Bcf. Specifically, eight vessels departed from Sabine Pass, four each from Corpus Christi and Freeport, three from Cameron, two from Cove Point, and one from Calcasieu Pass. In the same timeframe, one LNG vessel, carrying 3 Bcf, docked for off-loading at the Everett LNG terminal in Boston Harbor, Massachusetts, according to shipping data from Bloomberg Finance, L.P.
Looking ahead to 2024, the natural gas market faces a range of potential challenges stemming from geopolitical tensions, economic dynamics, weather uncertainties, and shifts in production and storage levels. Notably, events such as the possible loss of the Nord Stream pipeline and the risk of supply disruptions underscore the market’s susceptibility to geopolitical issues. Concerns about global inflation and an economic slowdown could dampen demand, with unpredictable weather patterns potentially resulting in lower-than-anticipated heating needs. While abundant underground gas storage inventories may act as a stabilizing factor for prices, the market could also be at risk of oversupply, leading to downward price pressures.
Despite these challenges, the natural gas market in 2024 presents several opportunities for growth. Rising global demand for LNG, particularly from Mexico, coupled with the consistent demand for U.S. LNG exports to Europe and Asia, offers substantial growth prospects. The development of new industrial projects and the expanding U.S. natural gas exports to Mexico provide significant avenues for expansion. Furthermore, ongoing retirements of coal-fired generation and the installation of new renewable energy sources may contribute to an increased reliance on natural gas-fired generation, at least in the short to medium term.
When it comes to the electricity market, Mid-Atlantic Power forwards for the 2024-2028 term experienced a modest uptick of +2%, while still showing a -5% decrease over the past month. The month-to-date average day-ahead settlement price for December at West Hub is $35.16/MWh, marking a notable -12% decrease compared to the preceding month’s average and a substantial -60% decline compared to the same period in 2022. On the other hand, Great Lakes Power forwards for the 2024-2028 term witnessed a slightly more pronounced increase of +3%, though still exhibiting a -5% decrease over the past month. AdHub in the GLR region reports a December month-to-date average day-ahead settlement price of $28.74/MWh, reflecting a -10% dip from the previous month and a significant -65% drop from the same period in 2022. Notably, the month-to-date average for Michigan stands at $30.63/MWh, showcasing a -5% decrease from the preceding month and a -53% decline compared to the same period last year. PJM’s Winter Outlook assures that the region is adequately equipped to meet electricity demands under mild to moderate weather conditions, though it acknowledges that prolonged periods of extreme cold weather still present reliability challenges. The ISO projects winter electricity demand to peak at 147,000 MW, coupled with nearly 4,000 MW of exports, against an available generation capacity of 181,000 MWs. Various scenarios were tested, encompassing lower natural gas volumes, reduced renewable generation, heightened power demand, and increased exports, all indicating the system’s anticipated reliability throughout the winter. These findings contrast with a recent NERC Winter Reliability Report, which highlighted the risk of inadequate electricity supplies in a significant portion of the U.S. bulk electricity system during winter, particularly due to extended cold snaps that could impact both electricity reliability and the fuel supply for natural gas-fired generators. PJM underscores improvements made since Winter Storm Elliott the previous Christmas, expressing confidence in the enhanced overall reliability of the system.
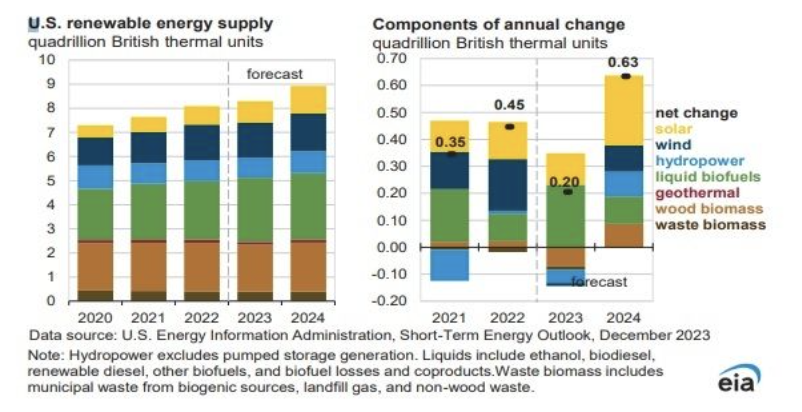
In 2024, electricity prices are anticipated to remain stable while sales are projected to increase by about 2%, amid ongoing challenges in the supply chain. The momentum toward a clean-energy transition is set to persist, supported by various drivers. A growing number of U.S. electric companies have committed to an 80% reduction in carbon emissions by 2030, advancing their timelines from the previous “net-zero by 2050” goal. The Inflation Reduction Act’s first-year anniversary in August 2023 saw substantial investments, surpassing US$122 billion in clean energy generation and over US$110 billion in clean-energy manufacturing for domestic supply chain development. The EIA also foresees the renewables to account for nearly 25 percent of U.S. renewable electricity generation in 2024, up from 22 percent in 2023 and 21 percent in 2022. Under these circumstances, F&D Partners has been advising their clients an Index + Capacity + Fixed Adder strategy, to maximize long-term savings.
F&D Partners was very successful in navigating one of the most volatile years in the energy markets by helping our clients save tremendously.
Contact us today for the newest strategies in the energy markets for 2023, 2024 and 2025.