

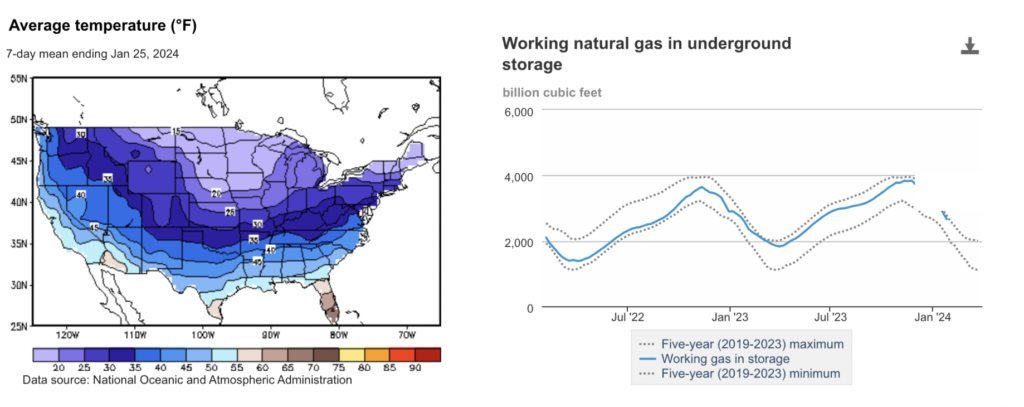
On Thursday, January 18, 2024, natural gas futures for the prompt month commenced trading at $2.824, marking a decrease from the previous day’s closing price of $2.870. The storage report for the week ending January 12 revealed a withdrawal of 154 BCF, falling short of analysts’ expectations of 176 BCF. This unexpected deviation triggered a downward spiral in the market, impacting not only the prompt month of February 2024 but also extending to all futures contracts up to the year 2025. As of January 12, storage volumes had increased by 12.4% compared to the same period the previous year, surpassing the 5-year average by 11.2%, a phenomenon not seen in quite some time. If the withdrawal rate continues at the five-year average of 13.8 Bcf per day for the remaining period, the total inventory on March 31 is projected to be 1,763 Bcf. This would be 130 Bcf higher than the five-year average of 1,633 Bcf for the same period.
By the close of trading on Thursday, the February 2024 future had breached the $2.70 threshold, concluding at $2.697. As market activities resumed on Friday, January 19, 2024, the downward trend persisted for both the prompt month and futures contracts through the end of 2025. At 10:15 AM on January 19, the prompt month experienced a further sell-off, dropping to $2.595, reflecting an additional decrease of 3.78%. This decline was indicative of the current storage strength and the absence of impending volatile weather conditions. From Wednesday, January 17th, to Wednesday, January 24th, spot prices for natural gas experienced declines at various locations, primarily due to a widespread increase in temperatures across the nation, resulting in reduced consumption. Price fluctuations ranged from a significant decrease of $1.31/MMBtu at Northwest Sumas to a modest increase of 91 cents at Algonquin Citygate.
In the Algonquin Citygate serving consumers in the Boston area, prices surged by 91 cents, climbing from $2.44/MMBtu on January 17th to $3.35/MMBtu by the end of the week. Prices reached a high of $8.67/MMBtu on January 22nd, almost doubling the reported price from January 19th, the last trading day. Notably, natural gas consumption in New England experienced a substantial 17.8% decline (0.7 billion cubic feet per day [Bcf/d]) during this week. This reduction was led by a significant 24.2% drop (0.6 Bcf/d) in residential and commercial sector consumption. Weather conditions in the Boston Area exhibited above-normal temperatures for the majority of the week, starting at a high of 46°F on January 18th and dropping to 31°F on January 24th, resulting in 202 heating degree days (HDDs) – a decrease of 64 HDDs compared to the previous report week. The Algonquin Gas Transmission pipeline issued an operational flow order (Notice 143337) on January 21st, instructing shippers to ensure that actual gas deliveries out of the system match or are less than scheduled deliveries.
In California, the price at PG&E Citygate decreased by 86 cents, going from $4.00/MMBtu on January 17th to $3.14/MMBtu by the close of the week. Similarly, prices at SoCal Citygate in Southern California dropped by 55 cents, moving from $3.42/MMBtu on January 17th to $2.84/MMBtu on January 24th. Natural gas consumption in California saw a 4.3% reduction (0.3 Bcf/d) during this week, primarily driven by a 7.5% decrease (0.2 Bcf/d) in natural gas consumed for power generation. In the Riverside Area, located inland of Los Angeles, average temperatures rose by 5°F from the previous week to 62°F, resulting in 22 HDDs – a decrease of 33 HDDs from the previous week and 44 HDDs below normal.
Moving to the Pacific Northwest, the price at Sumas, situated on the Canada-Washington border, fell significantly by $1.31, declining from $3.35/MMBtu on January 17th to $2.04/MMBtu on January 24th. Net flows into the region increased by 21% over the past two weeks following a cold snap in mid-January that reduced net flows into the region, primarily from Canada and the Desert Southwest. In the Seattle City Area, average temperatures rose by 7°F to 52°F, resulting in 92 HDDs – a decrease of 63 HDDs from normal and 49 HDDs less than the previous report week. Natural gas consumption in the Pacific Northwest experienced a substantial 22% decline (0.7 Bcf/d) during this week, with the residential and commercial sector recording a notable 34% decrease (0.5 Bcf/d).
Finally, at the Waha Hub in West Texas, near Permian Basin production activities, prices fell by 68 cents during this report week, moving from $2.08/MMBtu on January 17th to $1.40/MMBtu on January 24th. The Waha Hub traded 83 cents below the Henry Hub price on January 24th, a notable increase from January 17th when it traded 36 cents below the Henry Hub price. On January 22nd, the El Paso Natural Gas Company issued a notice of a high linepack condition due to lower natural gas deliveries and higher supply receipts, though the notice was canceled on January 23rd. Net outflows from the Permian Basin increased by 5% (0.7 Bcf/d) week over week and are up 12% (1.7 Bcf/d) from two weeks ago.
During the week spanning from January 17th to January 24th, the dynamics between supply and demand in the natural gas market exhibited notable shifts. According to data from S&P Global Commodity Insights, the average total supply of natural gas saw a modest increase of 1.1% (1.2 Bcf/d) compared to the previous report week. This growth was propelled by a significant 3.2% (3.2 Bcf/d) rise in dry natural gas production, reaching an average of 103.1 Bcf/d. However, net imports from Canada experienced a substantial decline of 22.8% (1.8 Bcf/d) from the previous week. It’s worth noting that despite the increase in production, dry natural gas production remained 2.7 Bcf/d below its pre-winter-storm peak of 105.8 Bcf/d reported for the week ending December 20.
On the demand side, there was a contrasting trend, with total U.S. consumption of natural gas falling significantly by 21.0% (23.9 Bcf/d) compared to the previous report week. This decline was attributed to milder weather conditions observed across most of the United States, leading to reduced demand in both the residential and commercial sectors, as well as in the electric power sector where space heating consumption decreased. Natural gas consumed for power generation registered a notable decline of 14.0% (5.2 Bcf/d) week over week. In the residential and commercial sectors, consumption witnessed a substantial drop of 33.2% (16.9 Bcf/d). The industrial sector also experienced a decrease in consumption by 7.0% (1.8 Bcf/d) during the same period. Furthermore, natural gas exports to Mexico slightly decreased by 0.7% (less than 0.1 Bcf/d), while natural gas deliveries to U.S. LNG export facilities (LNG pipeline receipts) averaged 14.0 Bcf/d, marking a modest increase of 0.9 Bcf/d compared to the previous week.
Average natural gas deliveries to U.S. LNG export terminals increased by 6.6% (0.9 Bcf/d) week over week, reaching an average of 14.0 Bcf/d, as reported by S&P Global Commodity Insights. Notable increases were observed in deliveries to terminals in South Louisiana, rising by 1.9% (0.2 Bcf/d) to 9.3 Bcf/d, and in South Texas, surging by 10.3% (0.3 Bcf/d) to 3.5 Bcf/d. Deliveries to terminals outside the Gulf Coast also experienced a substantial uptick, climbing by 41.9% (0.4 Bcf/d) to 1.2 Bcf/d. During this period, twenty-eight LNG vessels, representing nine from Sabine Pass, four each from Calcasieu Pass, Cameron, Corpus Christi, and Freeport, two from Elba Island, and one from Cove Point, with a combined LNG-carrying capacity of 103 Bcf, departed U.S. ports. On the other hand, only one LNG vessel with a carrying capacity of 3 Bcf docked for off-loading at the Everett LNG terminal in Boston Harbor in Massachusetts. Additionally, Freeport LNG, situated south of Houston, Texas, reported that one of its three liquefaction trains would be offline for approximately one month for electrical repairs following the recent winter storm, adding a layer of complexity to the overall LNG terminal operations during this specific week. On the other hand, progress on Canada’s Trans Mountain Pipeline expansion project has surpassed 95% completion. Upon its activation, this expansion is poised to almost triple the pipeline’s existing capacity of 300,000 barrels per day (b/d), facilitating the transportation of crude oil from Alberta’s landlocked oil sands to Canada’s Pacific Coast. The objective? To cater to new markets in Asia and the U.S. West Coast. Originally slated for early this year, the project faces potential delays of up to two years due to a recent ruling, as disclosed by the project’s owner. Currently, the Trans Mountain Pipeline offers a crucial outlet for waterborne crude oil exports from Canada. It traverses from Edmonton, Alberta, to Burnaby, a port near Vancouver in British Columbia. With the expansion project, the aim is to boost the pipeline’s capacity by an additional 590,000 b/d, elevating its total capacity to 890,000 b/d.
The PJM 2024 Load Forecast Report indicates an anticipated rise in both summer and winter peak loads. Released in December, the report forecasts a 15-year increase in the RTO-wide summer peak load to 193,123 MW by 2039, reflecting an average annual growth of 1.6%. Similarly, the winter peak load is expected to reach 178,241 MW by 2038/39, with an average annual growth of 1.9% over the same period. The report compares historical peak loads and weather-normalized peaks with projections for 2023 and 2024, particularly focusing on the PJM Eastern Mid-Atlantic (E-MAAC) region. Several factors contribute to the projected increases, including the introduction of a new vendor to aid PJM’s load forecasts, adjustments in S&P Global Commodity forecasts, and access to more accurate data regarding behind-the-meter solar, batteries, and electric vehicles. The report also highlights significant unexpected load changes, particularly in load and peak shaving behavior, with data centers in the AEP, APS, and DOM zones being a significant factor in these adjustments.
According to reports, wholesale electricity prices for 2024 across most regions of the United States are projected to remain similar to or slightly lower than those of 2023. This stability is attributed to the consistent costs of generation fuels. However, it is warned in the report that periods of heightened demand or constraints in power market supply could result in temporary spikes in wholesale prices.
Wholesale prices in the U.S. are anticipated to fluctuate between $30 per megawatt hour (MWh) and $40 per MWh in regions outside of the Northeast. In contrast, in the Northeast, particularly in New York and New England, prices are expected to rise. The forecast indicates an average price of $48/MWh in New York and $60/MWh in New England.
F&D Partners was very successful in navigating one of the most volatile years in the energy markets by helping our clients save tremendously.
Contact us today for the newest strategies in the energy markets for 2023, 2024 and 2025.