

NATURAL GAS
The Henry Hub spot price experienced a decline of 13 cents, dropping from $1.57 per million British thermal units (MMBtu) on March 13th to $1.44/MMBtu on March 20th. Regarding Henry Hub futures prices, the April 2024 NYMEX contract expired on Tuesday at $1.575/MMBtu, reflecting a decrease of 12 cents from March 13th. The May 2024 NYMEX contract price also saw a decrease, reaching $1.718/MMBtu, down by 13 cents from March 13th. The price of the 12-month strip, averaging May 2024 through April 2025 futures contracts, decreased by 9 cents to $2.728/MMBtu. More specifically, natural gas spot prices experienced fluctuations across various locations. Notably, there was a decline in prices, with the most significant drop occurring at Algonquin Citygate, where prices decreased by $1.14. Conversely, there was a modest increase of 21 cents observed at the Waha Hub. In the Northeast, despite a decrease in temperatures, natural gas prices experienced a decline. For instance, at the Algonquin Citygate serving Boston, prices fell from $2.66/MMBtu to $1.52/MMBtu within the mentioned period. The cooler weather, averaging 37°F, led to an increase in heating degree days (HDDs), resulting in higher demand for natural gas in the residential, commercial, and electric power sectors. Additionally, the arrival of a liquefied natural gas (LNG) cargo at Constellation Energy’s Everett LNG terminal bolstered the region’s supply. Similarly, in New York City, prices at the Transcontinental Pipeline Zone 6 trading point decreased by 36 cents. The colder weather, with temperatures averaging 42°F, spurred an increase in HDDs and consequently higher consumption in the residential and commercial sectors. In West Texas, at the Waha Hub near Permian Basin production activities, prices remained negative but slightly improved compared to the previous week. This negative trend has been attributed to warmer weather reducing consumption and ongoing maintenance on the El Paso Natural Gas pipeline system. In the Midwest, prices also fell during the mentioned period. For example, at the Chicago Citygate, prices dropped by 24 cents. Despite lower temperatures compared to the previous week, consumption in the residential and commercial sectors increased, contributing to the overall regional consumption rise.
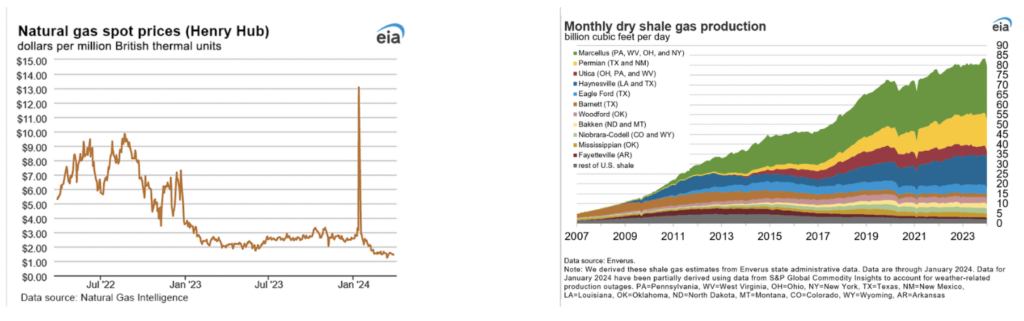
Net withdrawals from storage amounted to 36 Bcf, contrasting with the five-year (2019–2023) average of 27 Bcf and last year’s withdrawals of 55 Bcf during the same period of time. Working natural gas stocks stood at 2,296 Bcf, marking an increase of 669 Bcf (41%) compared to the five-year average and 430 Bcf (23%) compared to the previous year. According to The Desk survey of natural gas analysts, estimates for the weekly net change ranged from withdrawals of 24 Bcf to 40 Bcf, with a median estimate of 30 Bcf. The average withdrawal rate from storage during the withdrawal season (November through March) is currently 25% lower than the five-year average. If this rate matched the five-year average for the remainder of the withdrawal season, the total inventory would reach 2,302 Bcf by March 31, surpassing the five-year average of 1,633 Bcf for that time of year by 669 Bcf. During the week ending March 15th, supply dynamics in the natural gas market saw an uptick, with data from S&P Global Commodity Insights indicating a 0.3% increase (0.3 Bcf/d) in average total supply compared to the previous week. However, dry natural gas production experienced a slight dip of 0.4% (0.4 Bcf/d), averaging 101.0 Bcf/d, while average net imports from Canada surged by 19.8% (0.7 Bcf/d) from the previous week. According to the latest report from the Energy Information Administration (EIA), demand for natural gas experienced a notable decrease across all sectors. Total U.S. consumption declined by 1.7 Bcf per day, falling from 81 to 79.3 Bcf per day compared to the previous week. Notably, the demand of 79.3 Bcf per day for the week ending March 13 reflects a substantial 13.1 Bcf per day decrease compared to the same period last year. The most significant decline in demand occurred in the residential and commercial sectors, which witnessed a decrease of 1.1 Bcf per day, dropping from 27.1 to 26 Bcf per day for the week ending March 13. This two percent decline in demand coincided with a general increase in temperatures observed across the country during the same period, resulting in reduced heating demand. Demand in the industrial sectors remained consistent seasonally, with an average daily consumption of 24 Bcf per day. However, a noteworthy shift occurred in the power generation sector, where average daily demand saw a change between the 2022 – 2023 and 2023 – 2024 winter heating seasons. During the 2022 – 2023 season, the average daily demand for power generation stood at approximately 31 Bcf per day, whereas for the ongoing 2023 – 2024 season, it has increased to 32 Bcf per day. This uptick of 2 Bcf per day in power generation demand seasonally suggests an amplified reliance on natural gas for power generation, particularly amidst the relatively mild winter experienced across the United States. Furthermore, natural gas exports to Mexico experienced a marginal decline of 1.4% (0.1 Bcf/d). Natural gas deliveries to U.S. LNG export facilities (LNG pipeline receipts) remained steady at an average of 12.9 Bcf/d, unchanged from the previous week. Freeport LNG, situated south of Houston, Texas, has brought one train back online while temporarily taking two offline for maintenance, expecting to operate with only one liquefaction train until May. Deliveries to terminals outside the Gulf Coast also showed no change, remaining at 1.2 Bcf/d. Between March 21st and March 27th, twenty-two LNG vessels departed U.S. ports, including those from Sabine Pass, Calcasieu Pass, Corpus Christi, Cameron, Elba Island, Cove Point, and Freeport, with a combined LNG-carrying capacity of 80 Bcf. Meanwhile, during the same period, one LNG vessel with a carrying capacity of 3 Bcf arrived at the Everett LNG terminal in Boston Harbor, Massachusetts, for off-loading. The U.S. Energy Information Administration (EIA) stated in its Short Term Energy Outlook (STEO) that natural gas production in the United States is anticipated to decrease in 2024, while demand is expected to reach a record high. EIA projects that dry gas production will ease from its peak of 103.79 billion cubic feet per day (bcfd) in 2023 to 103.35 bcfd in 2024, as several producers scale back their drilling activities following a drop in prices to a 3-1/2-year low in February. However, in 2025, output is forecasted to rise to 104.43 bcfd. EIA forecasts that the lower gas prices will stimulate domestic gas consumption, increasing from a record 89.09 bcfd in 2023 to 89.68 bcfd in 2024, before slightly easing to 89.21 bcfd in 2025 as prices begin to rise. If these projections materialize, 2024 would mark the first decline in output since 2020, when the COVID-19 pandemic led to a decrease in demand for the fuel. It would also signify the first instance of demand increasing for four consecutive years since 2016.
ELECTRICITY
In the Mid-Atlantic region, forward power prices exhibit a steady upward trend extending to 2028, with the 2024-2025 period showing a stronger influence from bearish natural gas fundamentals, while the subsequent years, 2026-2028, appear more influenced by concerns regarding electricity reliability amid shifting generation fuel mix. Meanwhile, in the Great Lakes Region, a similar pattern emerges, with prices inching higher through 2028. Similarly, the 2024-2025 period is affected by bearish natural gas fundamentals, transitioning to electricity reliability concerns in 2026-2028. A weather forecast indicates a movement of warmth from the Midwest eastward over the next few days, followed by colder air descending into the Rockies and Plains. This pattern is expected to shift warmth back to the South and parts of the Midwest. However, despite similarities, there are some differences in price dynamics between the regions. In the Mid-Atlantic, power forwards for the 2025-2028 term have risen by 2% over the past week and 7% over the past month, while in the Great Lakes, forwards remained unchanged for 2024-2025 and increased by 2% for 2026-2028 over the week, with a 7% increase over the month. Additionally, the month-to-date, day-ahead average settlement prices for March reflect variations: in the West Hub, it’s $25.71/MWh, showing a 3% increase from February but a 12% decrease from the previous year, whereas in Michigan and Ameren, settlement prices are lower compared to both February and the previous year.
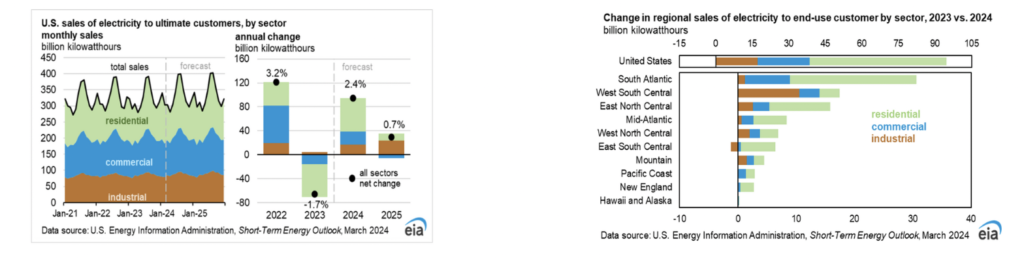
Sales of electricity to U.S. end-use customers are projected to increase by 2% in 2024 and by 1% in 2025, following a 2% decline in 2023. It is expected that electricity consumption will grow in all major consuming sectors this year, particularly in the residential sector, where a 4% increase is anticipated. Much of the forecasted year-over-year growth in residential electricity consumption is anticipated to occur during the summer months of 2024, which is expected to be warmer, with 7% more forecast cooling degree days in 2Q24 and 3Q24 compared to the same quarters in 2023. The expected hotter summer is also anticipated to boost U.S. electricity consumption in the commercial sector. Improving macroeconomic conditions are likely to drive up electricity sales to both the commercial and industrial sectors by a combined 2%. The forecast weather trends for summer 2024 and winter 2024–25 are expected to increase residential consumption in all regions of the United States compared to 2023. Sales of electricity to the residential and commercial sectors are projected to rise the most this year in the South Atlantic (6% and 2%, respectively). Industrial electricity consumption is expected to increase the most in the West South Central region (up 4%), continuing a strong upward trend since the pandemic. The addition of new utility-scale solar generating capacity is expected to drive a significant increase in solar electricity generation in 2024 and 2025. The electric power sector added 19 gigawatts (GW) of solar capacity in 2023, an increase of 27%, and it is anticipated that 36 GW will be added in 2024 and another 35 GW in 2025. With this new capacity, solar is expected to provide 6% of total U.S. electricity generation in 2024 and 7% in 2025, up from a share of 4% in 2023. The increase in generation from renewable sources, particularly solar, is likely to decrease generation from fossil fuel sources. It is expected that the share of U.S. generation fueled by natural gas will fall from an average of 42% in 2023 to 41% in 2025, while the share of U.S. coal generation is anticipated to fall from 17% last year to 14% by 2025. Despite low natural gas prices, significantly more electricity generation fueled by natural gas is not expected due to significant coal plant retirements over the past few years, leaving the most efficient coal plants still in operation. Nearly 20% of U.S. coal-fired generating capacity has been retired since 2020, and the remaining coal fleet has been operating at historically low capacity factors. Coal stocks held by the electric power sector experienced a slight increase in February following a 3% decline in January, attributed to cold weather in the middle of the month causing a brief spike in natural gas prices and increased coal usage for power generation. It is anticipated that coal stocks will ascend from 130 million short tons (MMst) in February to nearly 160 MMst in May. Despite expectations of low natural gas prices during the summer, a decrease of 11% in coal stocks is forecasted from May to September as electric power plants resort to coal to fulfill incremental demand for air conditioning. Subsequently, coal stocks are projected to rise again in the fall, culminating in almost 150 MMst by year-end, marking the highest level since mid-2016. Projections suggest that stocks will maintain elevated levels in 2025, reaching approximately 160 MMst in May 2025 before declining to nearly 130 MMst by December 2025. In terms of coal exports, a 1% increase is forecasted for 2024, followed by a further 4% increase in 2025, while coal consumption by the U.S. electric power sector is anticipated to decline by 7% in 2024 and an additional 5% in 2025. With high coal stocks and declining domestic consumption, a 15% reduction in coal production is expected for 2024. Looking ahead to 2025, a further 6% decline in coal production is forecasted as 11 GW of coal-generating capacity goes offline.
CANADA
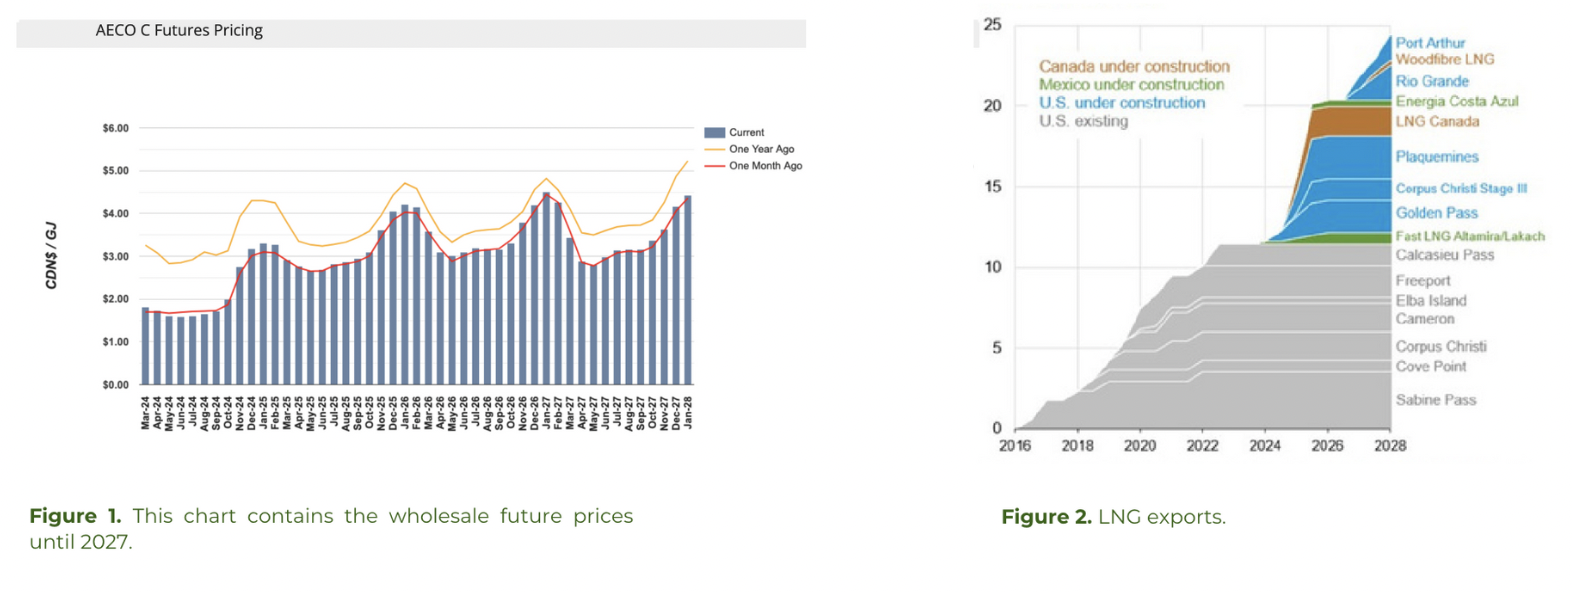
While global population growth may be decelerating, the imperative to produce more exajoules over the coming decades remains critical to meet the escalating energy demands of burgeoning economies. Projections indicate a surge of 1.7 billion individuals by 2050, effectively akin to accommodating the populations of both China and the United States within a single generation. In the nearer term, an additional 834 million people are anticipated by 2035, tantamount to another Europe in size. This necessitates an extra 93 Quad BTU of energy, nearly equivalent to the current energy consumption of the United States. The energy landscape manifests a divergent path across the globe. Developed nations exhibit a trajectory marked by efficiency enhancements, resulting in a 13% reduction in per capita consumption over the past two decades in Europe and North America, roughly translating to an annual decline of 0.7%. Although population growth in these regions is moderating, it has not reversed outright. The future of natural gas exports from Canada is poised for significant growth, mirroring the robust trajectory seen in the United States. With expanding export capacity and multiple ongoing projects, Canada is set to substantially increase its LNG exports in the coming years. By 2025, the surge in LNG exports is anticipated to exert upward pressure on prices. In British Columbia, on the western coast of Canada, there are currently two LNG export projects in the works, boasting a collective capacity of 2.1 billion cubic feet per day (Bcf/d). LNG Canada, with its substantial export capacity of 1.8 Bcf/d, is slated to commence operations in 2025. Additionally, Woodfibre LNG, with a capacity of 0.3 Bcf/d, is set to become operational in 2027. It’s worth noting that the Canada Energy Regulator (CER) has granted authorization for an additional 18 LNG export projects. These projects, when combined, have a total capacity of 29 Bcf/d, indicating a significant expansion in Canada’s LNG export infrastructure. This upward price pressure is driven by strong demand from both domestic and international markets. In December 2023, LNG exports reached an all-time monthly high of 8.6 million tons. The US is building over 14 Bcf/d in the next 3 years which will lead to an increase of demand for gas from Canada while in Europe, there is a growing shift away from Russian gas due to the conflict in Ukraine, leading to increased LNG imports. The LNG Canada project in Kitimat, B.C., set to come online in 2025, will be joined by projects in Mexico, the Republic of Congo, Mauritania, Russia, Australia, and Gabon. By 2026, the world could see a 13% increase in LNG supply capacity—the largest annual increase in history. Simultaneously, China is emerging as a major growth market for LNG demand, with Chinese buyers striking long-term deals. By 2028, the United States is slated to reach more than 160 mmtpa of export capacity—more than double the current output of Qatar, the world’s second largest exporter. The United States and Qatar alone could account for 80 percent of global supply additions by 2030. On the domestic front, the demand for natural gas in 2022 exceeded pre- pandemic levels by 6%. Sectoral shifts in consumption are primarily influenced by weather conditions, with natural gas-fired power plants supplying approximately 40% of U.S. electricity annually, making electricity demand a significant factor. It is projected that there will be an 11% increase in U.S. natural gas consumption for electricity in 2024 alone compared to the previous five-year average. Additionally, colder winter temperatures directly impact natural gas consumption in residential and commercial sectors, with combined consumption expected to rise by 5% in 2024 due to warmer-than-average temperatures in January and December 2023. As a result, the competition for gas supplies between domestic consumers and exporters is likely to result in price fluctuations.
F&D Partners was very successful in navigating one of the most volatile years in the energy markets by helping our clients save tremendously.
Contact us today for the newest strategies in the energy markets for 2024 – 2028.